Fig. 3
Download original image
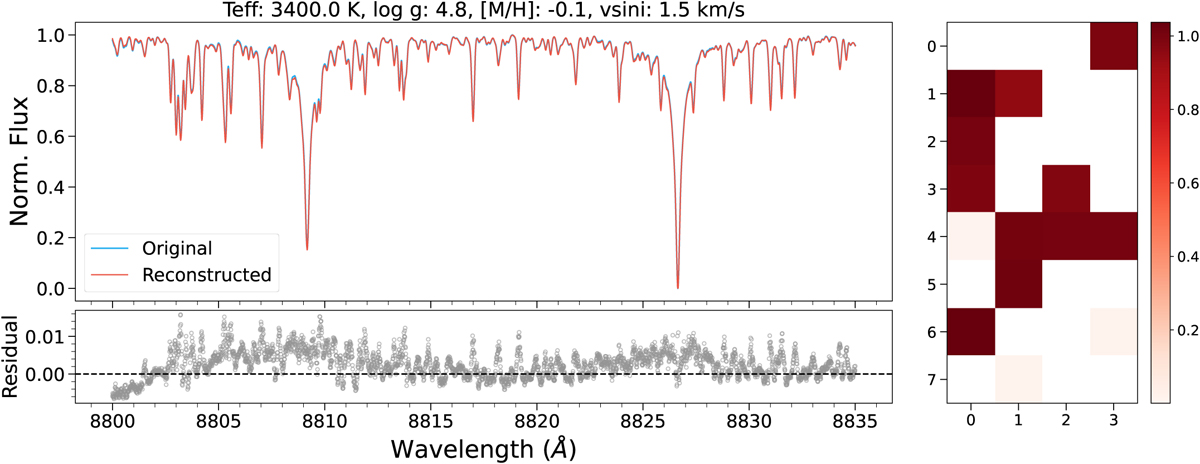
Reconstructed spectrum (left) and latent representation (right) of a PHOENIX-ACES synthetic spectrum for one of the trained AEs. Left panel: comparison of the original (blue) and reconstructed (red) spectrum. Both spectra overlap as they are almost similar. The title shows the stellar parameters of the synthetic spectrum. Reconstruction residuals (original-reconstructed) are shown in the bottom panel. Right panel: 32-dimensional latent space of the input spectrum obtained by the encoder, reshaped to a 8×4 matrix only for a better visibility. The colour scale indicates the strength of the features. The decoder uses this compressed representation to obtain the reconstructed spectrum.
Current usage metrics show cumulative count of Article Views (full-text article views including HTML views, PDF and ePub downloads, according to the available data) and Abstracts Views on Vision4Press platform.
Data correspond to usage on the plateform after 2015. The current usage metrics is available 48-96 hours after online publication and is updated daily on week days.
Initial download of the metrics may take a while.