Fig. 11
Download original image
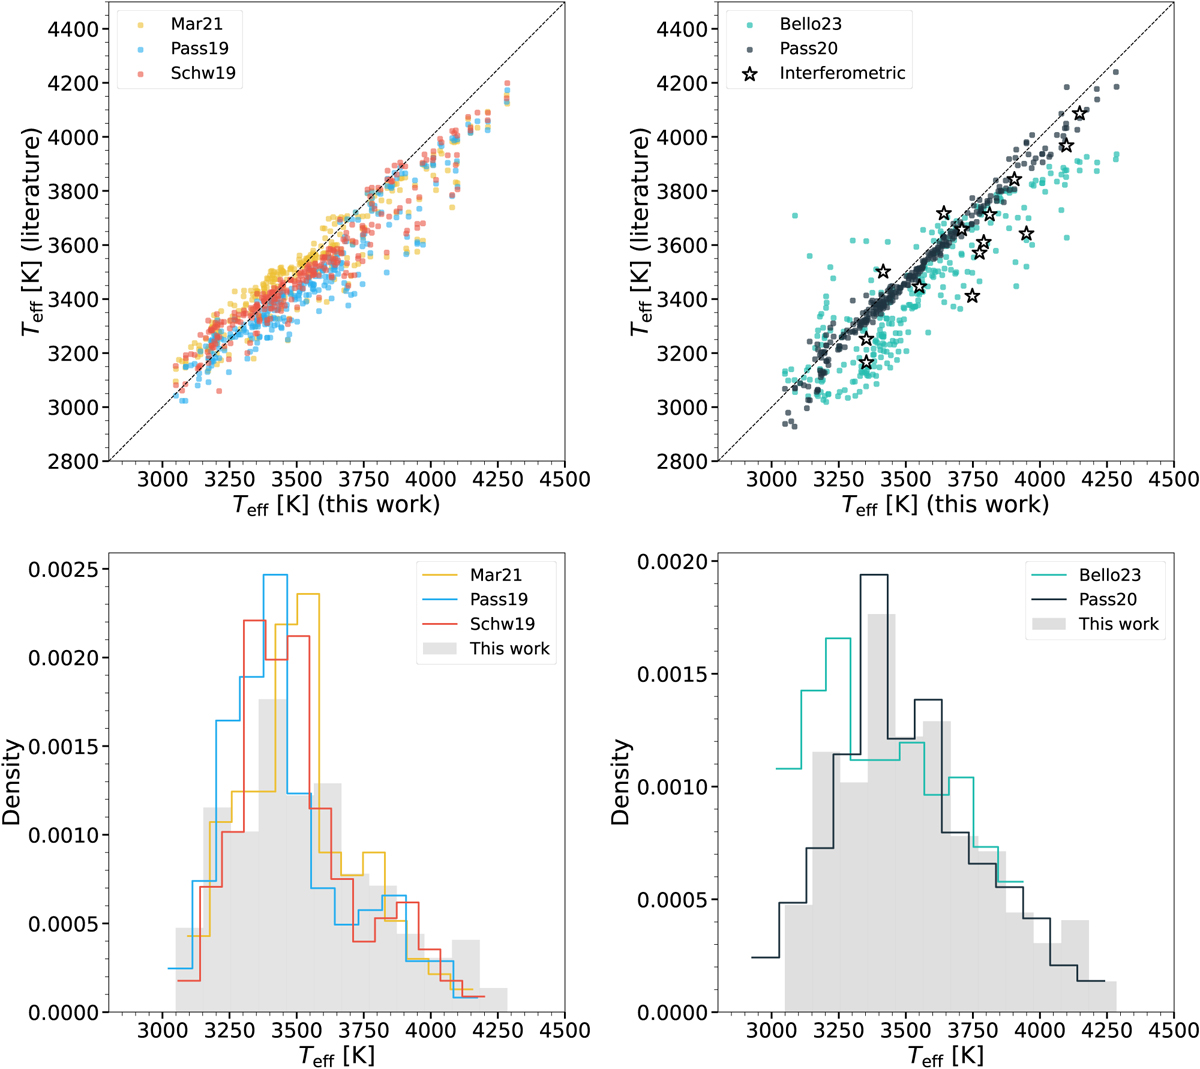
Comparison between our derived Teff values and the literature. The left panels include the results from Mar21 (yellow), Pass19 (blue), and Schw19 (red). The right panels include the work from Bello23 (cyan) and the results obtained following the DL methodology described by Pass20 (dark blue). The black stars in the top right panel correspond to the interferometrically derived Teff values from Bello23. The dashed black lines in the top panels correspond to the 1:1 relation. For the bin width in the histograms shown in the bottom panels, we used the default parameters of the seaborn histplot function.
Current usage metrics show cumulative count of Article Views (full-text article views including HTML views, PDF and ePub downloads, according to the available data) and Abstracts Views on Vision4Press platform.
Data correspond to usage on the plateform after 2015. The current usage metrics is available 48-96 hours after online publication and is updated daily on week days.
Initial download of the metrics may take a while.