Fig. 5
Download original image
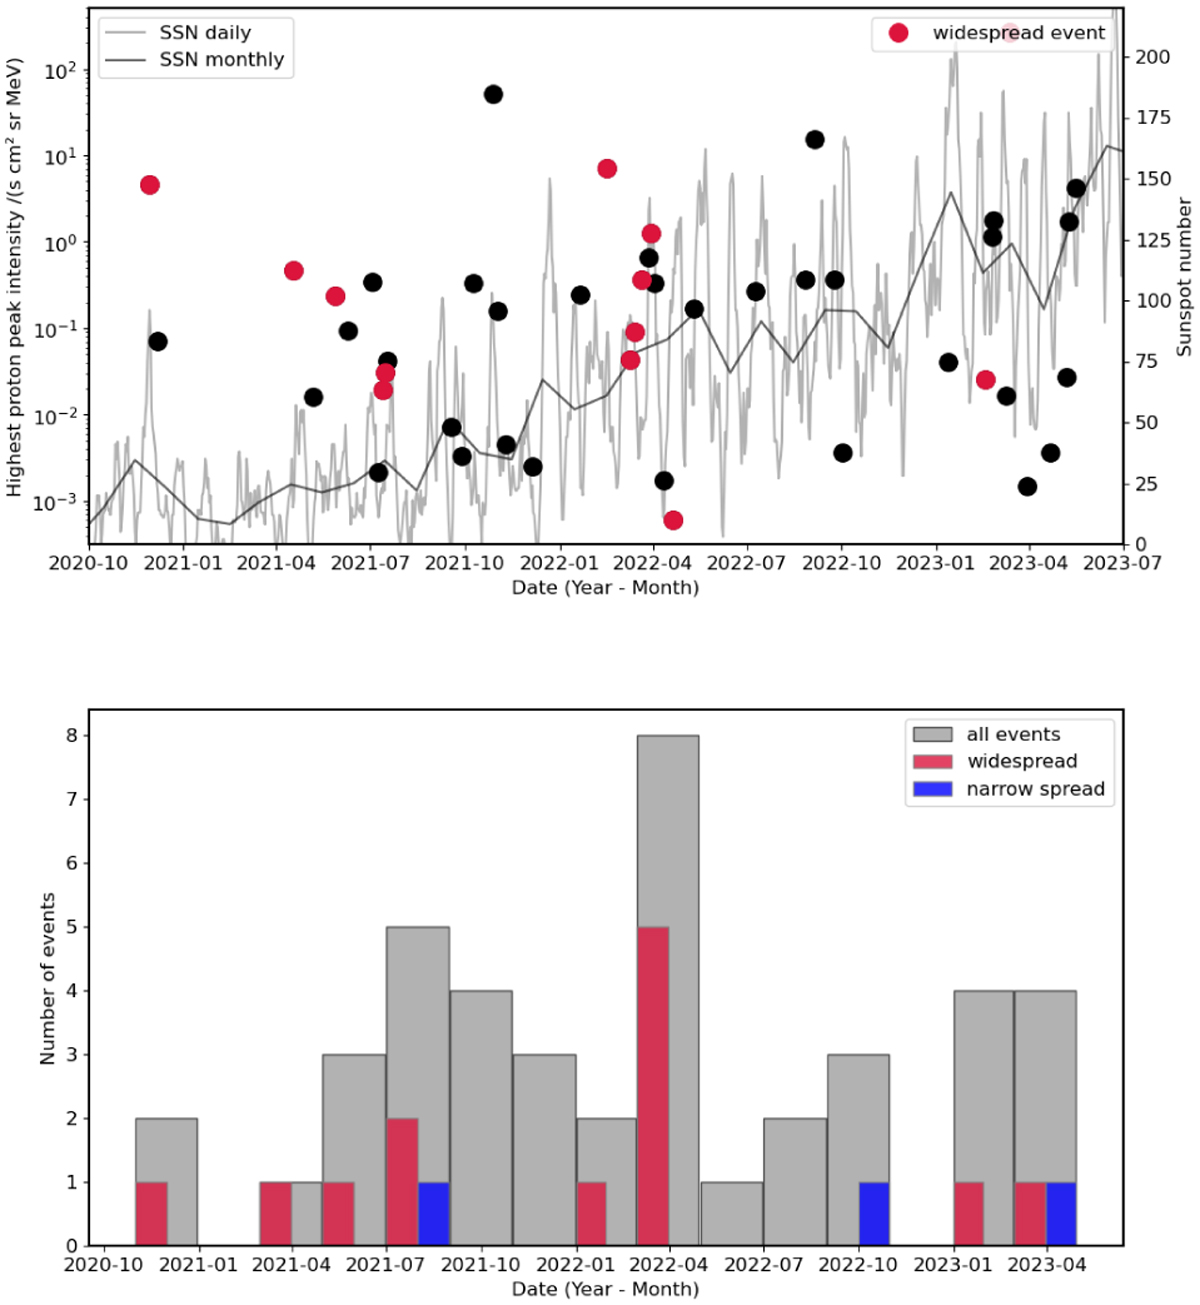
Top: highest > 25 MeV-proton peak intensity observed (black dots) in each event as a function of time, with widespread events marked in red. Daily and monthly sunspot numbers are shown by gray curves (right axis) provided by WDC-SILSO, Royal Observatory of Belgium, Brussels. Bottom: histogram of event occurrences, with all events in gray, widespread events in red, and narrow-spread events in blue.
Current usage metrics show cumulative count of Article Views (full-text article views including HTML views, PDF and ePub downloads, according to the available data) and Abstracts Views on Vision4Press platform.
Data correspond to usage on the plateform after 2015. The current usage metrics is available 48-96 hours after online publication and is updated daily on week days.
Initial download of the metrics may take a while.