Fig. 1
Download original image
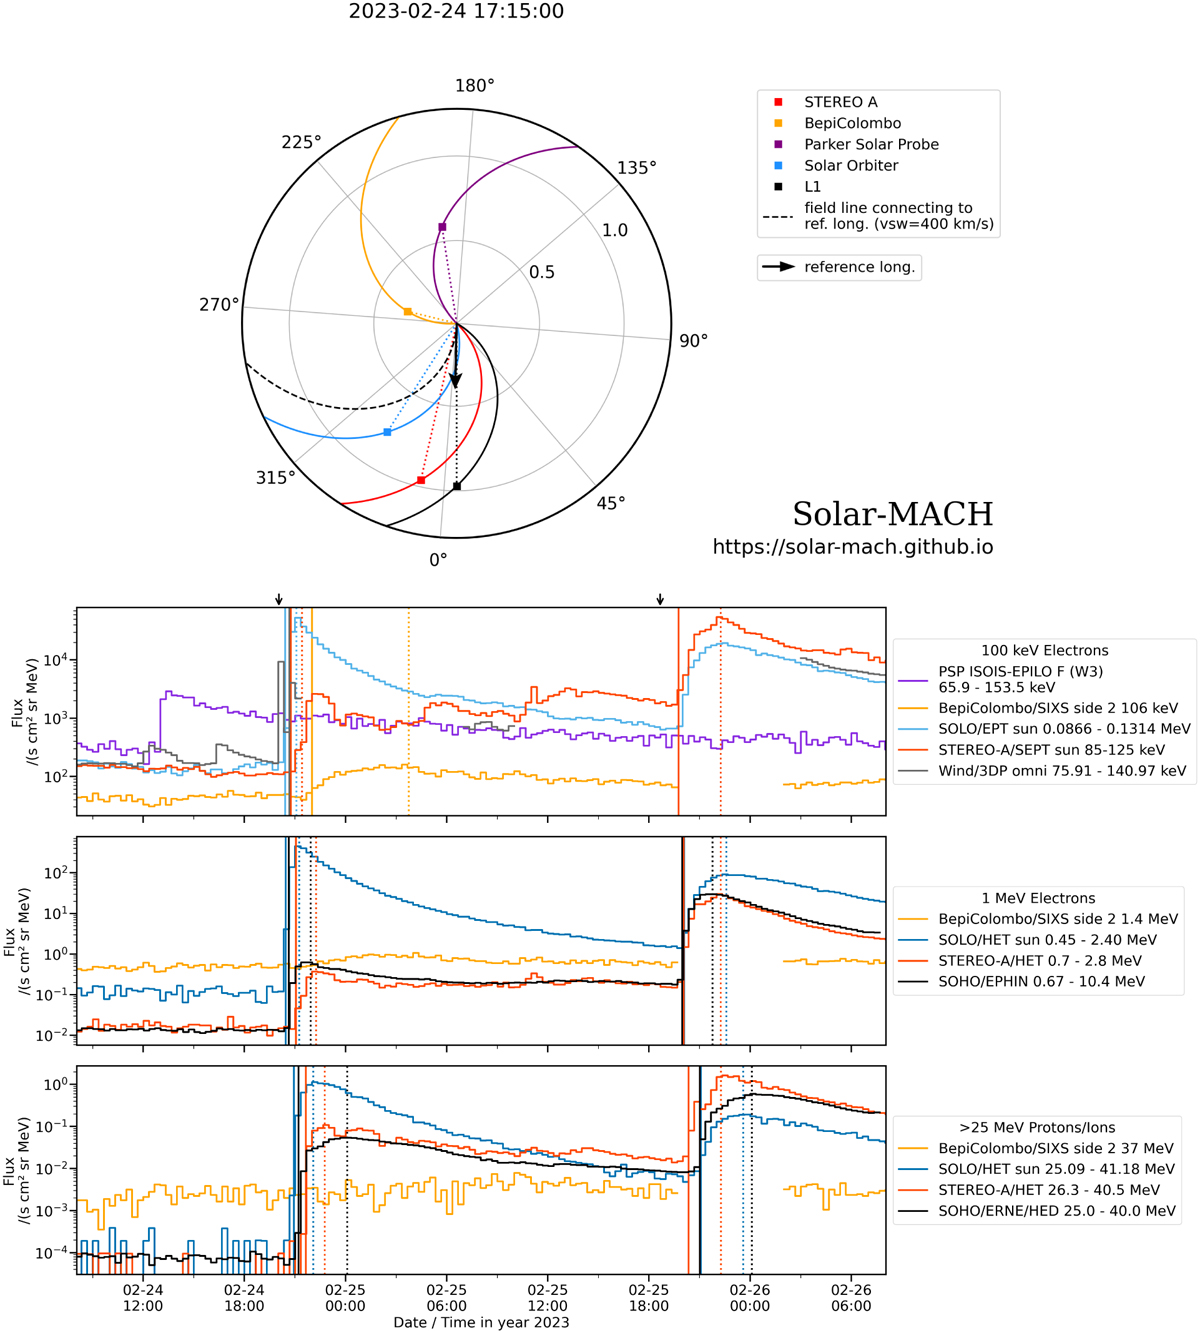
Multi-S/C events of February 24 and 25, 2023. The top plot presents the longitudinal configuration of S/C in the heliographic equatorial plane with respect to the longitude of the associated flare (black arrow) for the event starting on 24 February. The plot was produced with the Solar-MACH tool (Gieseler et al. 2023). The colored spirals denote the magnetic field lines connecting each observer with the Sun. The dashed black spiral represents the field line connecting with the flare. The bottom plot shows the intensity time series of ~100-keV electrons (top), ~1-MeV electrons (middle), and >25-MeV protons (bottom). Parker did not observe the events but a previous event happening earlier on 24 February. Since there is no obvious electron foreground in the EPI-Lo electron measurements (top panel) during the second event, the counts during this time period are background, assumed to be primarily caused by galactic cosmic rays. Parker/HET data were not available during the shown time period. The black arrow on top of the upper panel denotes the times of the associated flares. Solid (dotted) lines mark the onset (peak) times, with colors corresponding to those of the S/C time series.
Current usage metrics show cumulative count of Article Views (full-text article views including HTML views, PDF and ePub downloads, according to the available data) and Abstracts Views on Vision4Press platform.
Data correspond to usage on the plateform after 2015. The current usage metrics is available 48-96 hours after online publication and is updated daily on week days.
Initial download of the metrics may take a while.