Fig. 3.

Download original image
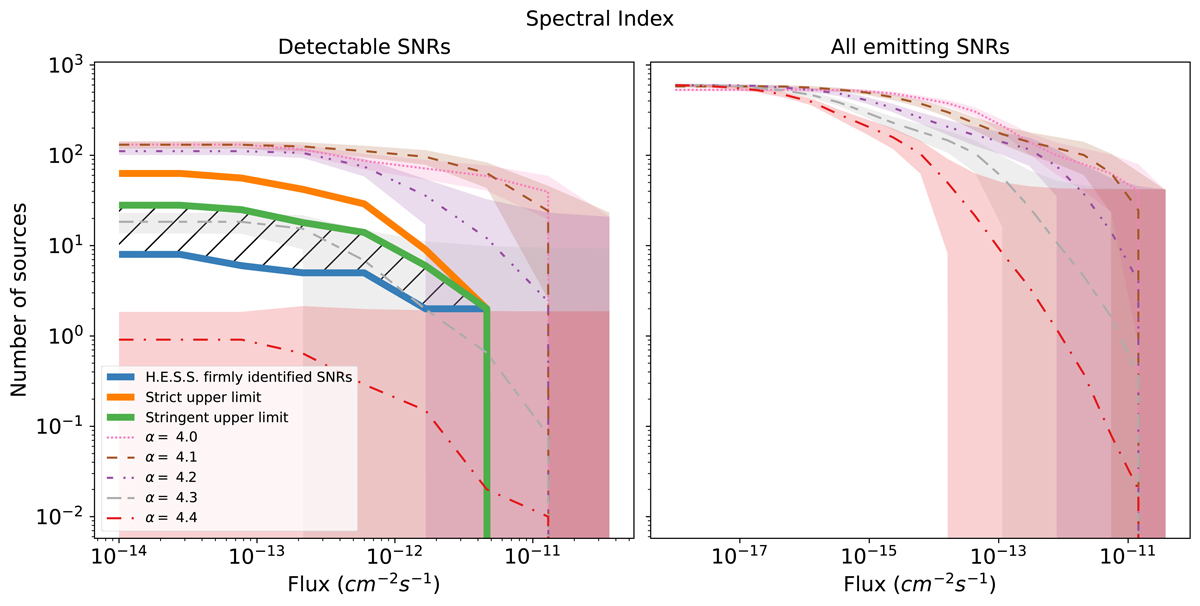
log N − log S distribution of detectable SNRs (left) and all emitting SNRs (right) based on 100 Monte Carlo realisations following a Steiman-Cameron source distribution, Emax estimation considering Bell instabilities, Kep = 10−3.0, and η = 7%. The spectral index of the accelerated particles α varies from 4 to 4.4. Shaded areas indicate ± one standard deviation. Thick solid lines correspond to the HGPS limits (blue: identified SNRs; green: identified and unidentified sources associated with SNRs; orange: all unidentified sources). The hatched region shows the ideal region for the simulated SNRs: between the identified SNRs and the sources associated with SNRs.
Current usage metrics show cumulative count of Article Views (full-text article views including HTML views, PDF and ePub downloads, according to the available data) and Abstracts Views on Vision4Press platform.
Data correspond to usage on the plateform after 2015. The current usage metrics is available 48-96 hours after online publication and is updated daily on week days.
Initial download of the metrics may take a while.


