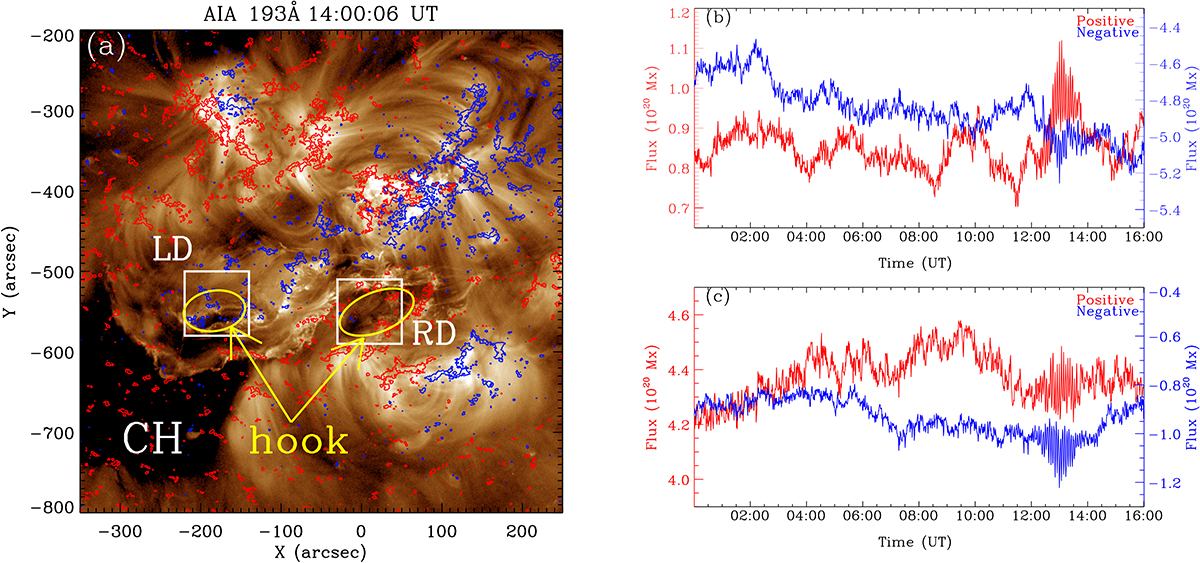
Fig. 5.
Download original image
Evolution of magnetic flux at two filament footpoints. The 193 Å image is overlaid with the longitudinal magnetic field. Red and blue contours indicate the magnetic field Bz at −50 G and 50 G, respectively. The white boxes represent the areas where the flux is calculated. The evolution of the left dimming (LD) flux is shown in panel b while the right dimming (RD) is shown in panel c. CH (written in white) represents the coronal hole. Yellow ellipses and arrows indicate the hooks at the ends of the flare ribbons.
Current usage metrics show cumulative count of Article Views (full-text article views including HTML views, PDF and ePub downloads, according to the available data) and Abstracts Views on Vision4Press platform.
Data correspond to usage on the plateform after 2015. The current usage metrics is available 48-96 hours after online publication and is updated daily on week days.
Initial download of the metrics may take a while.