Open Access
Fig. 3.
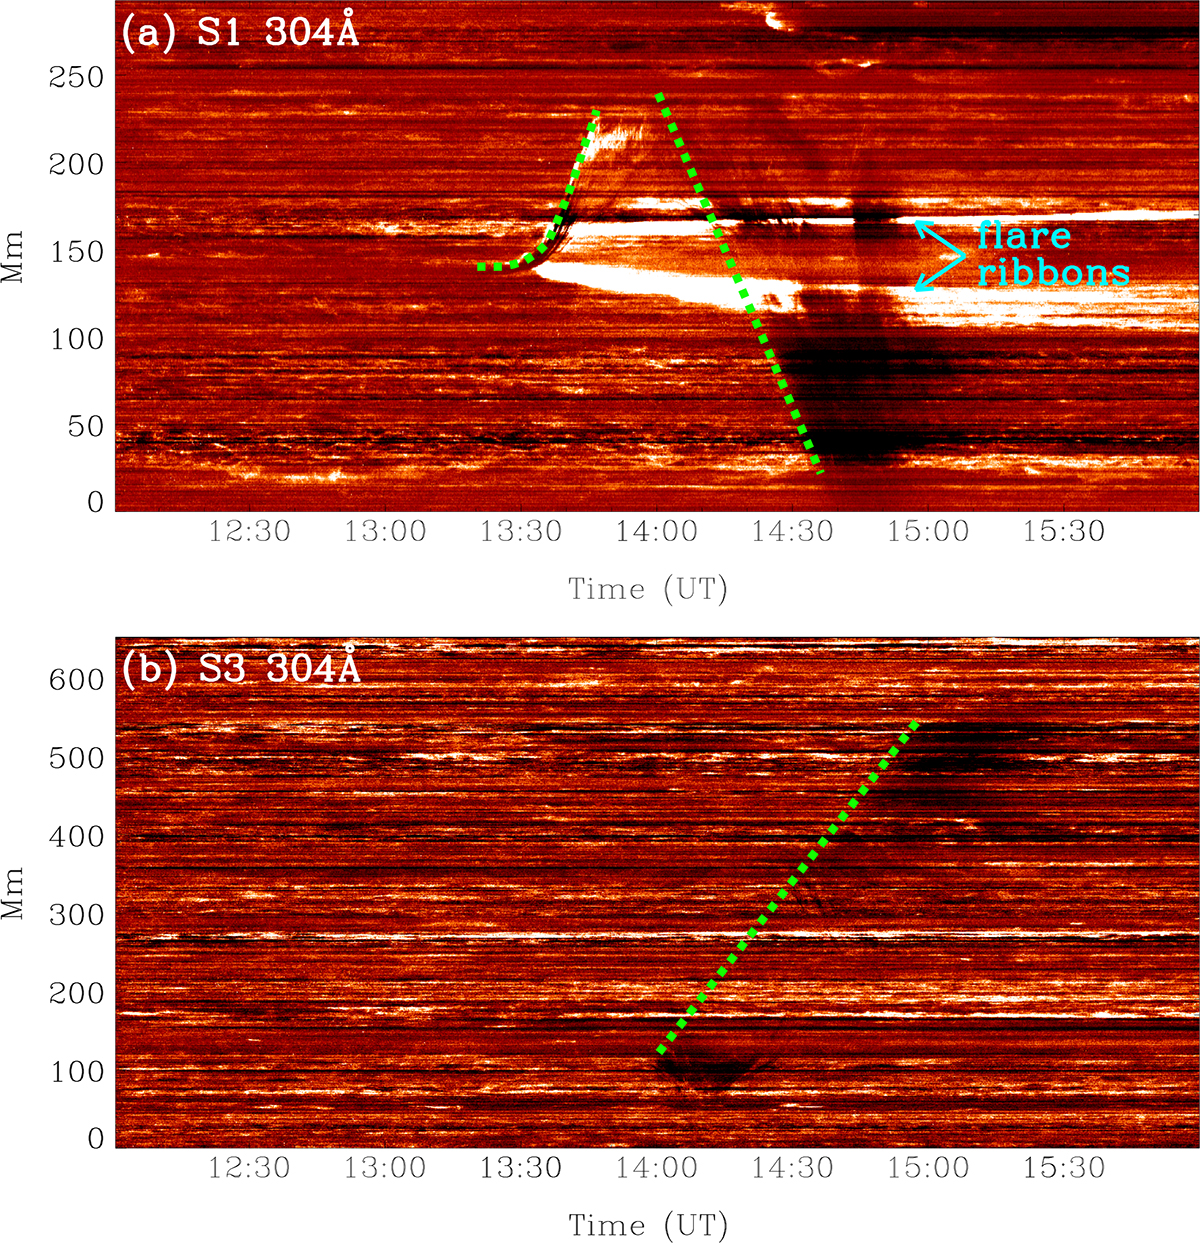
Download original image
Time–distance diagrams of the filament in AIA 304 Å for two stages. The diagrams show the rising and initial eruption of the filament along S1 (top panel) and subsequent deflection (bottom panel) along S3. The positions of flare ribbons are marked by cyan arrows.
Current usage metrics show cumulative count of Article Views (full-text article views including HTML views, PDF and ePub downloads, according to the available data) and Abstracts Views on Vision4Press platform.
Data correspond to usage on the plateform after 2015. The current usage metrics is available 48-96 hours after online publication and is updated daily on week days.
Initial download of the metrics may take a while.