Fig. 2.
Download original image
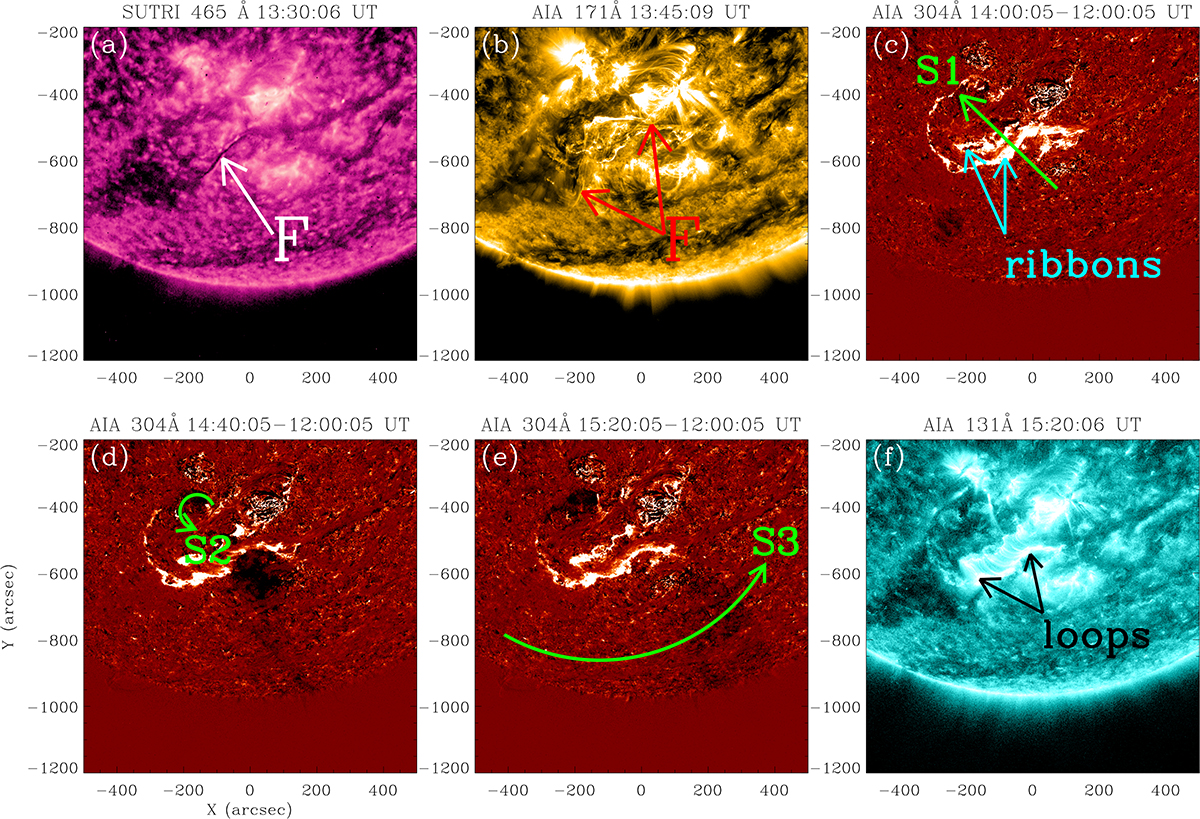
Evolution of the filament eruption in multiple wavelengths between 13:30 UT and 15:20 UT. The filament rises up (white and red arrows in panels a and b). Two flare ribbons are highly visible in difference images in AIA 304 Å (14:00−14:40−15:20 minus 12:00 UT) (panels c–e). Cyan and black arrows stand for flare ribbons and post-flare loops in panels c and f, respectively. At 14:00 UT, the south ribbon is extended and turns to the north, creating a remote brightening. At its end, a remote dimming appears at 14:00 UT in S2 during the eruption. Three slices, labeled S1, S2, and S3, along the direction of filament eruption (initial stage), the dimming region propagation, and filament deflection are indicated by green arrows (panels c–e). S1 is along the straight arrow, and S2 and S3 are the arc slices. These slices are used for the time–distance analysis in Figs. 3 and 4.
Current usage metrics show cumulative count of Article Views (full-text article views including HTML views, PDF and ePub downloads, according to the available data) and Abstracts Views on Vision4Press platform.
Data correspond to usage on the plateform after 2015. The current usage metrics is available 48-96 hours after online publication and is updated daily on week days.
Initial download of the metrics may take a while.