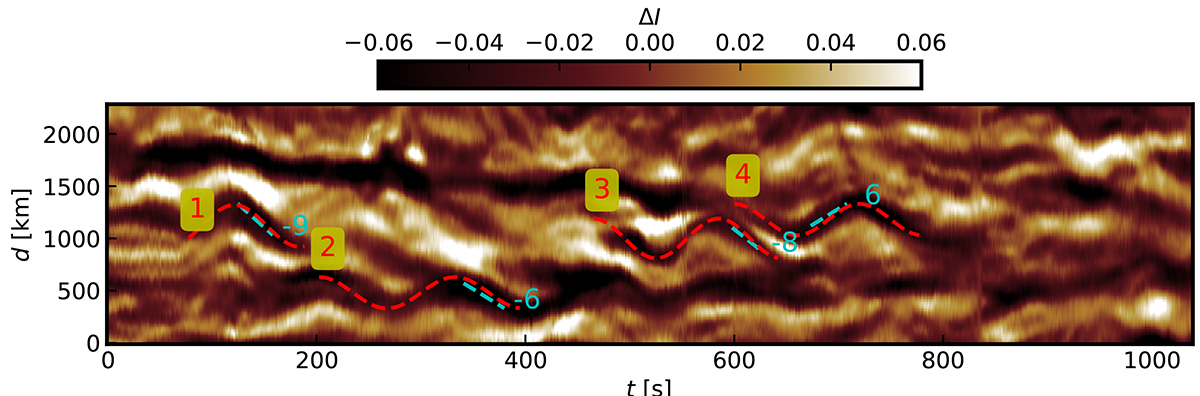
Fig. 3.
Download original image
Time–distance ΔI map constructed along the slit FIL. Each cyan-colored dashed line segment traces the trajectory of a filament at each instant, and its slope corresponds to the instantaneous velocity at one particular instant, as explicitly specified by a cyan-colored number (in units of km s−1). Each red sinusoidal curve traces the transverse oscillation of the filament, which is indexed by red numbers ranging from 1 to 4.
Current usage metrics show cumulative count of Article Views (full-text article views including HTML views, PDF and ePub downloads, according to the available data) and Abstracts Views on Vision4Press platform.
Data correspond to usage on the plateform after 2015. The current usage metrics is available 48-96 hours after online publication and is updated daily on week days.
Initial download of the metrics may take a while.