Fig. 2.
Download original image
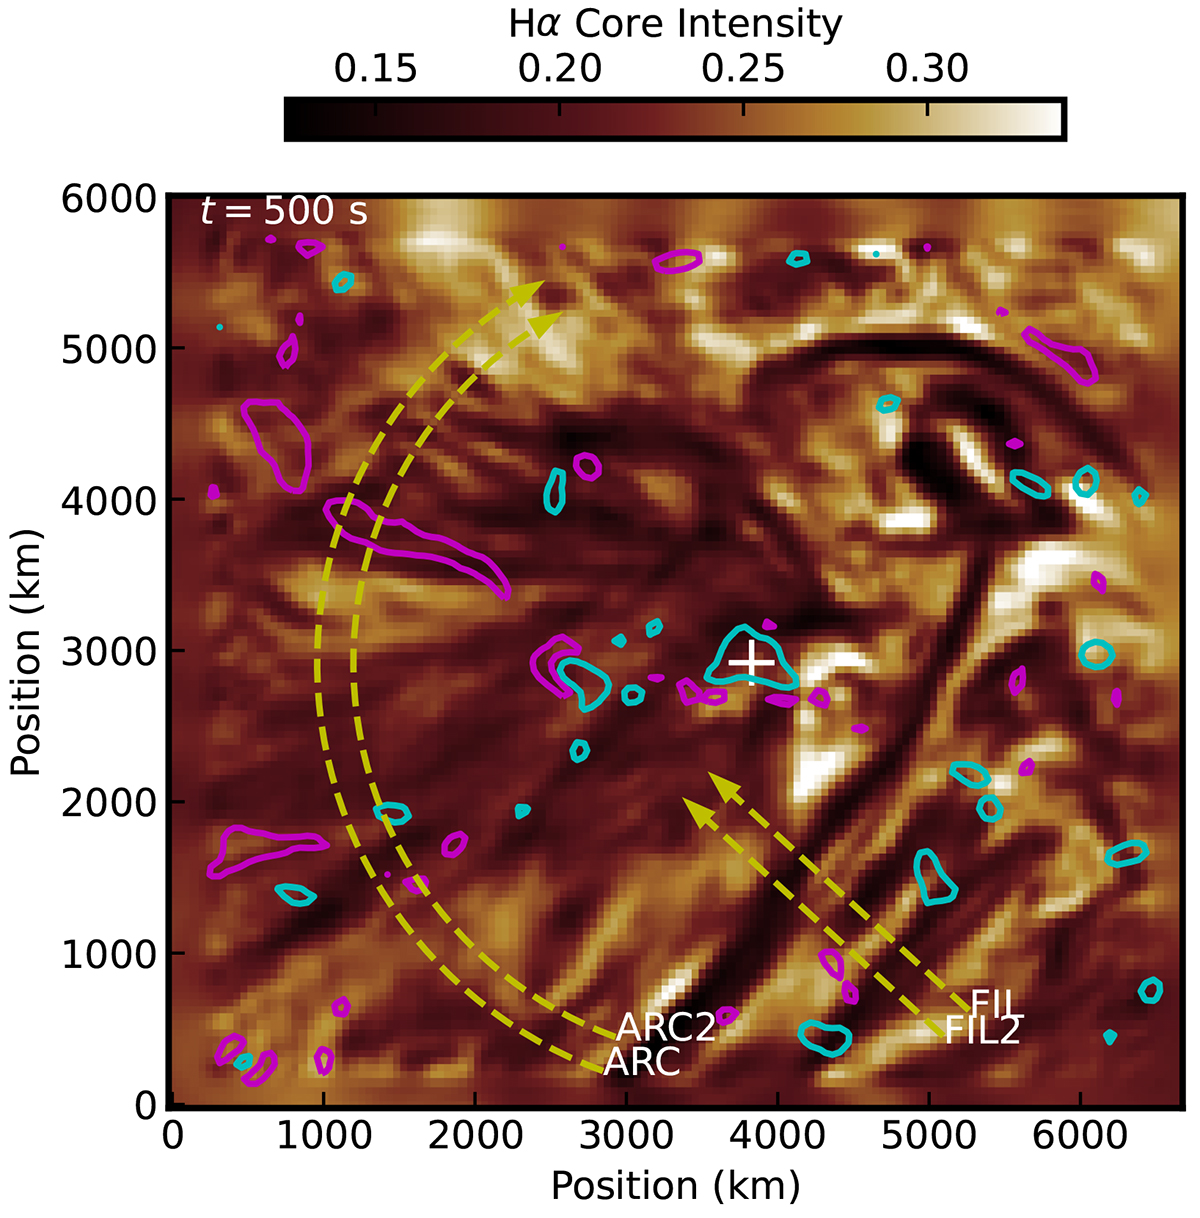
Hα core intensity map taken at 500 s after the start of observations. The dashed arrows indicate the two main slits (FIL and ARC) and the two auxiliary slits (FIL2 and ARC2). The cyan-colored and magenta-colored contours represent ±1σ levels of offband intensity at −1.5 Å, and the plus symbol marks the center of the offband bright concentration co-spatial with the magnetic concentration of positive polarity.
Current usage metrics show cumulative count of Article Views (full-text article views including HTML views, PDF and ePub downloads, according to the available data) and Abstracts Views on Vision4Press platform.
Data correspond to usage on the plateform after 2015. The current usage metrics is available 48-96 hours after online publication and is updated daily on week days.
Initial download of the metrics may take a while.