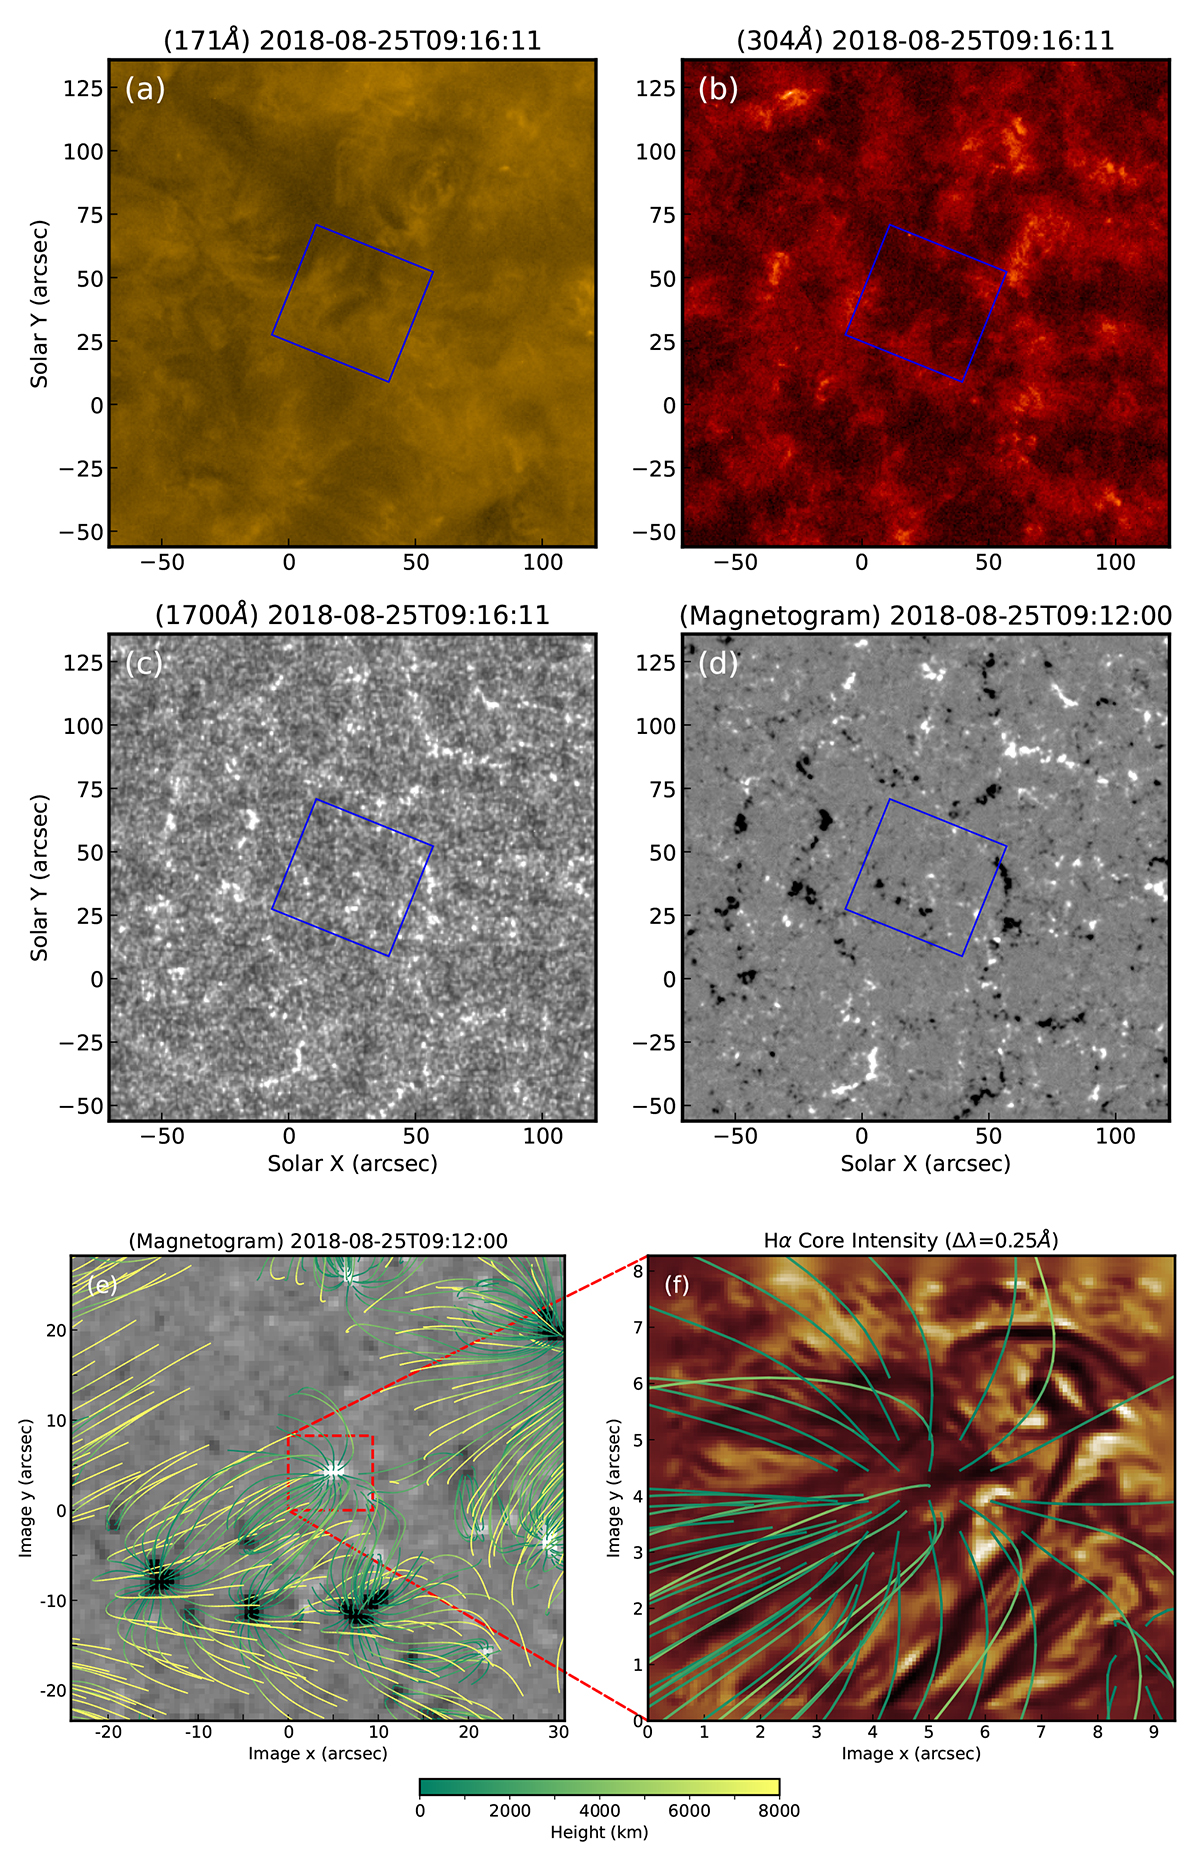
Fig. 1.
Download original image
Images of the observed region. a, b, c: context SDO/AIA images. d: SDO/HMI magnetogram. The blue rectangle indicates the 55″ × 51″ FOV of the submagnetogram below. e: SDO/HMI submagnetogram rotated to match the MiHI image frame where the origin is located in the lower left corner of the 9.2″ × 8.2″ MiHI FOV (red rectangle). The colored curves denote the projected magnetic field lines of the constructed potential field configuration with color representing height above the surface. f: MiHI Hα intensity image with the projected field lines superimposed. Most of these field lines inside the MiHI FOV have heights of < 4000 km.
Current usage metrics show cumulative count of Article Views (full-text article views including HTML views, PDF and ePub downloads, according to the available data) and Abstracts Views on Vision4Press platform.
Data correspond to usage on the plateform after 2015. The current usage metrics is available 48-96 hours after online publication and is updated daily on week days.
Initial download of the metrics may take a while.