Fig. 5.
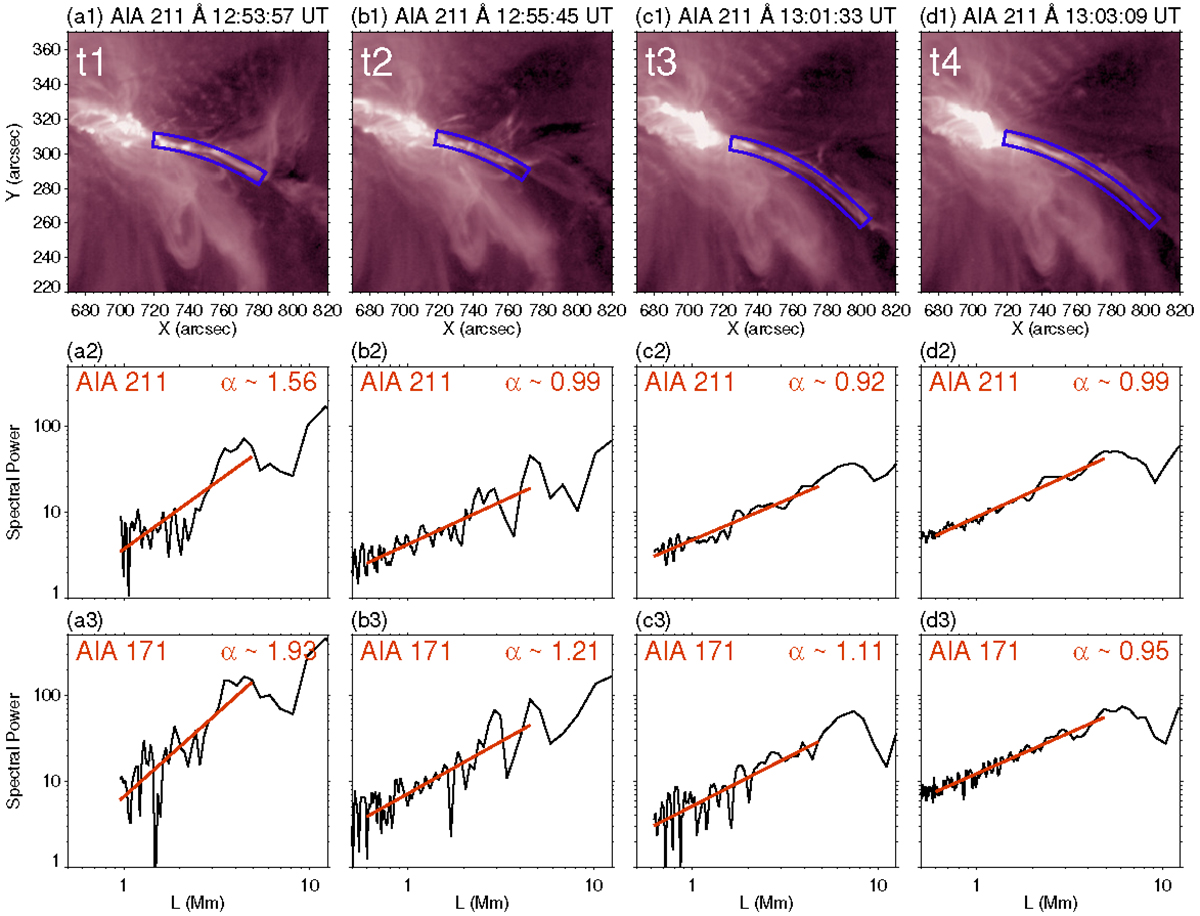
Download original image
Power spectrum analysis for AIA 211 Å and 171 Å intensity along the current sheet. (a1)–(d1): AIA 211 Å images at t1, t2, t3, and t4. (a2)–(d2): spectrum distributions of AIA 211 Å intensity along the long side of the blue regions in (a1)–(d1) in the spatial frequency domain. (a3)–(d3): spectrum distributions of AIA 171 Å intensity along the long side of the blue regions in (a1)–(d1) in the spatial frequency domain. The red lines represent a fitting power-law behavior in the spatial range of 0.6−5 Mm.
Current usage metrics show cumulative count of Article Views (full-text article views including HTML views, PDF and ePub downloads, according to the available data) and Abstracts Views on Vision4Press platform.
Data correspond to usage on the plateform after 2015. The current usage metrics is available 48-96 hours after online publication and is updated daily on week days.
Initial download of the metrics may take a while.