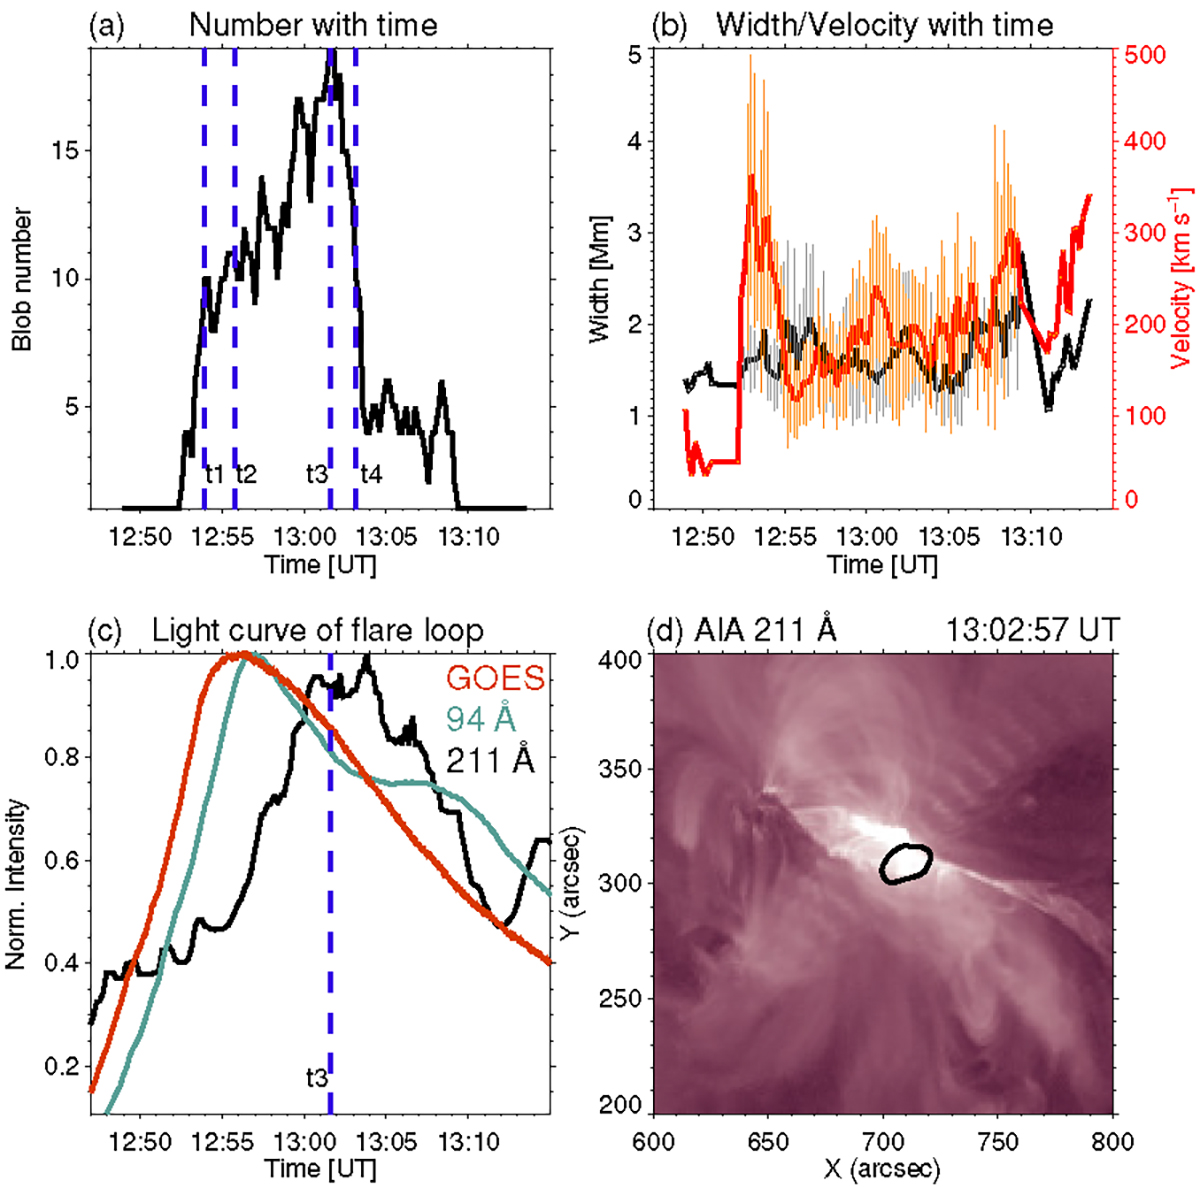
Fig. 4.
Download original image
Variations of parameters for plasma blobs. (a): variation of blob number. The blue dashed lines represent the four instances (t1, t2, t3, and t4) that are used for the power-spectrum analysis in Fig. 5. (b): variations of blob width (black curve) and velocity (red curve). In (b), the vertical gray and orange lines indicate the standard errors. (c): normalized intensity variations of GOES 1−8 Å and AIA 94/211 Å in the region marked by the black contour in (d). In (a) and (c), the blue dashed lines marked by “t3” also represent the peak instance of the blob number. (d): AIA 211 Å image at 13:02:57 UT, showing a region (black contour) near the bottom of the current sheet.
Current usage metrics show cumulative count of Article Views (full-text article views including HTML views, PDF and ePub downloads, according to the available data) and Abstracts Views on Vision4Press platform.
Data correspond to usage on the plateform after 2015. The current usage metrics is available 48-96 hours after online publication and is updated daily on week days.
Initial download of the metrics may take a while.