Fig. 3.
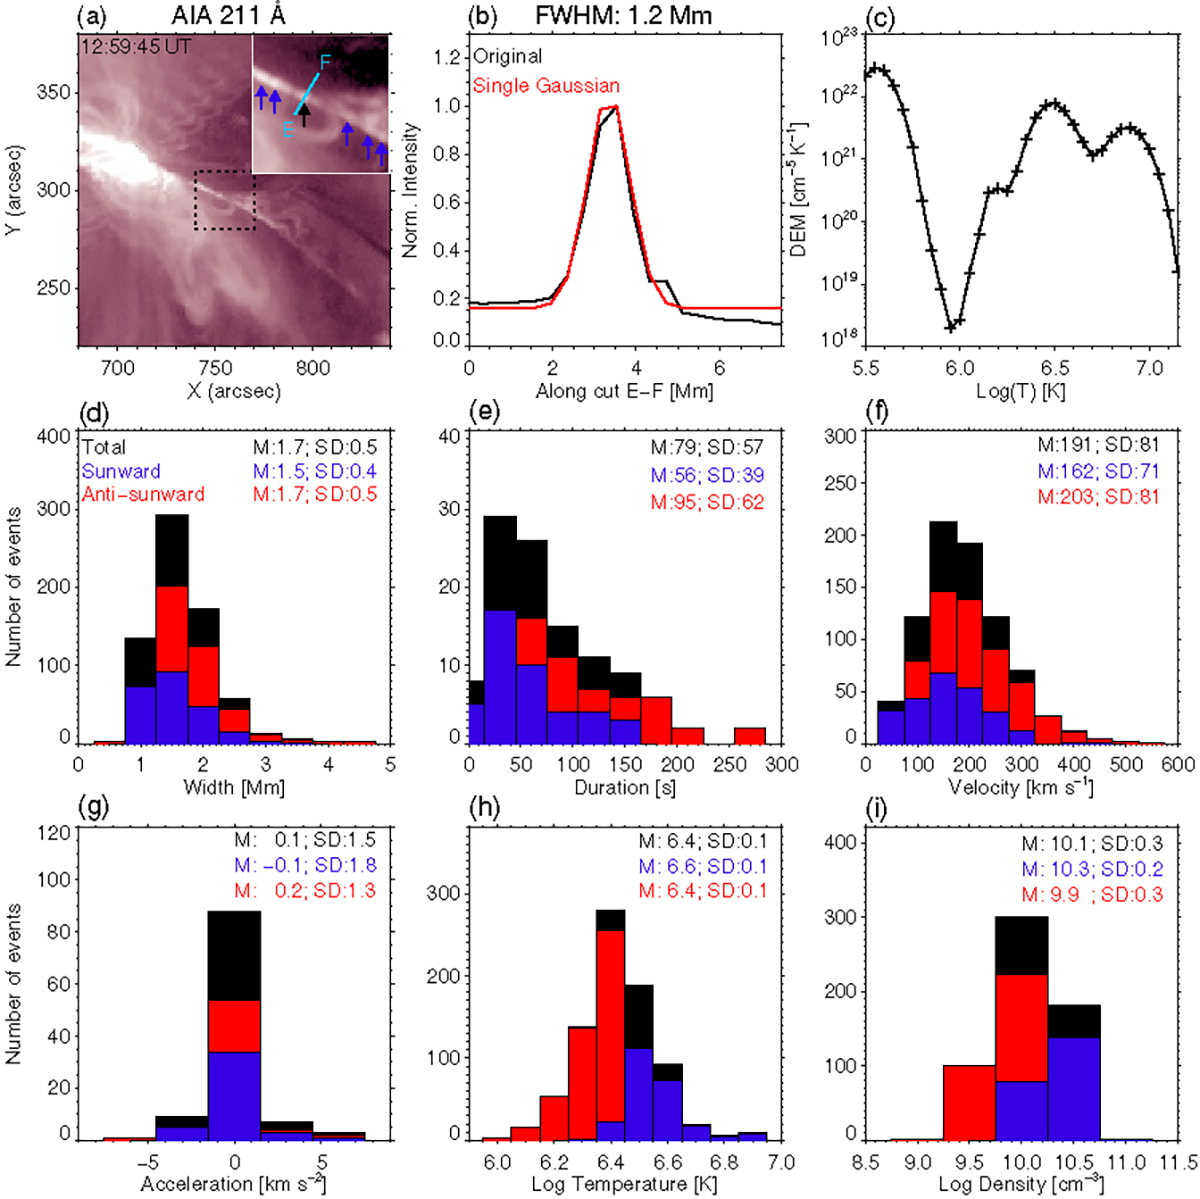
Download original image
Plasma blobs identified in current sheet and their parameters. (a): AIA 211 Å image at 12:59:45 UT showing several plasma blobs. The region of the inset in (a) is marked by the black box. The blue and black arrows in the inset indicate several plasma blobs. (b): normalized intensity variation (black) along cut E–F shown in (a) and its Gaussian fit (red). (c): DEM distribution of the blob marked by the black arrow in (a). (d)–(i): distributions of the plasma blob parameters. The black histogram is obtained from the total plasma blobs, while the blue and red ones are obtained from the sunward- and anti-sunward-moving blobs, respectively. “M” and “SD” represent the average values and standard deviations, respectively. An animation of the AIA 211 Å images and the ones processed by the MGN method are available online, showing the bidirectionally propagating plasma blobs. It covers a duration of ∼24 min from 12:48:57 UT to 13:13:33 UT. In the left and middle panels of the animation, the dot-like symbols mark the blob locations, while the blue and green numbers represent the sunward- and anti-sunward-moving blobs, respectively.
Current usage metrics show cumulative count of Article Views (full-text article views including HTML views, PDF and ePub downloads, according to the available data) and Abstracts Views on Vision4Press platform.
Data correspond to usage on the plateform after 2015. The current usage metrics is available 48-96 hours after online publication and is updated daily on week days.
Initial download of the metrics may take a while.