Fig. 2.
Download original image
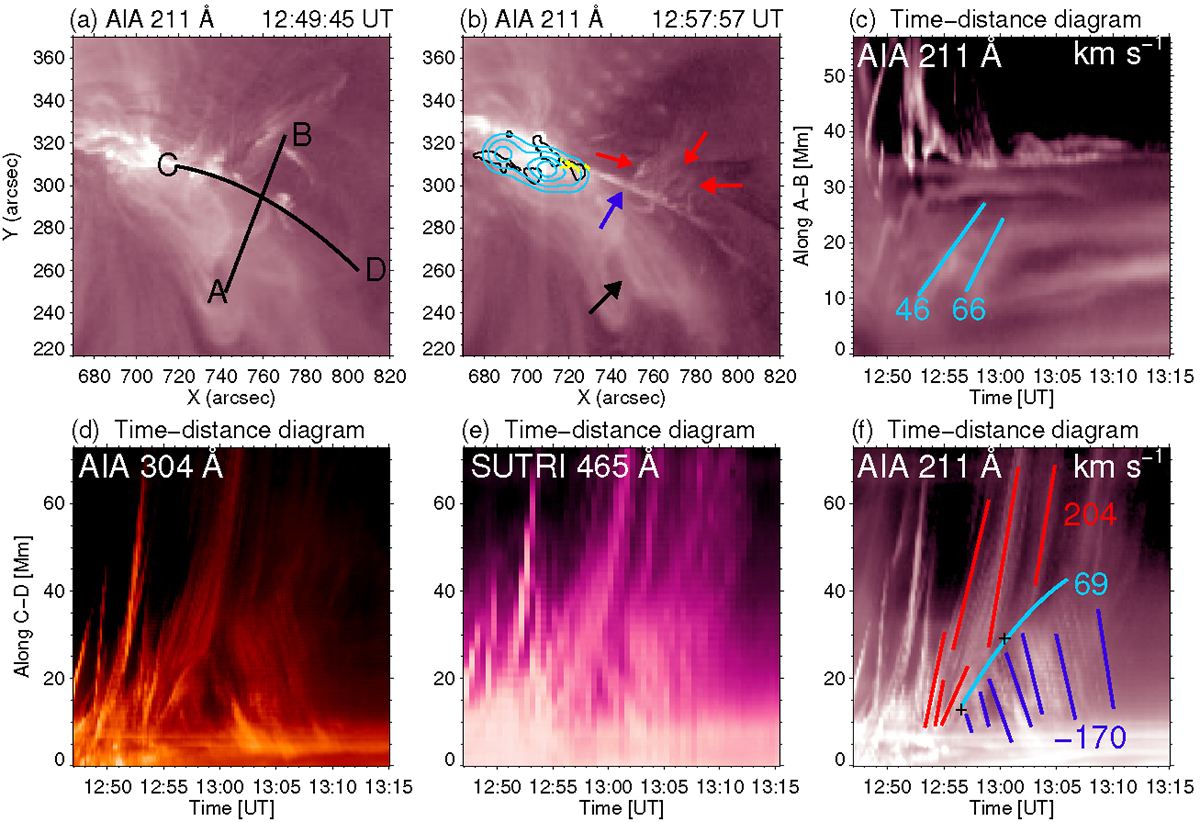
Plasma flows observed during solar eruption. (a) and (b): AIA 211 Å images at 12:49:45 UT and 12:57:57 UT, respectively. In (a), cut A–B is used to construct the time-distance diagram in (c), while cut C–D is used to construct the time-distance diagrams in (d)–(f). In (b), the black arrow indicates coronal loops that are observed continuously moving to the current sheet during the solar eruption, and the blue and red arrows indicate the main current sheet and split ones, respectively. The black and cyan contours in (b) indicate the enhanced AIA 1600 Å emission and the HXI 20−30 keV source near 12:53 UT, respectively. The yellow dot-like symbols represent some of the sunward-moving blobs. The cyan curves in (c) indicate the motions of the coronal loops. In (f), the cyan curve marks the rising motion of the reconnection site, while the blue and red lines indicate the bidirectional flows in the current sheet. The two black plus symbols mark the section of the curve that is used to calculate the maximum velocity. The numbers in (c) and (f) represent the velocities of the flows in the unit of km s−1.
Current usage metrics show cumulative count of Article Views (full-text article views including HTML views, PDF and ePub downloads, according to the available data) and Abstracts Views on Vision4Press platform.
Data correspond to usage on the plateform after 2015. The current usage metrics is available 48-96 hours after online publication and is updated daily on week days.
Initial download of the metrics may take a while.