Fig. 1.
Download original image
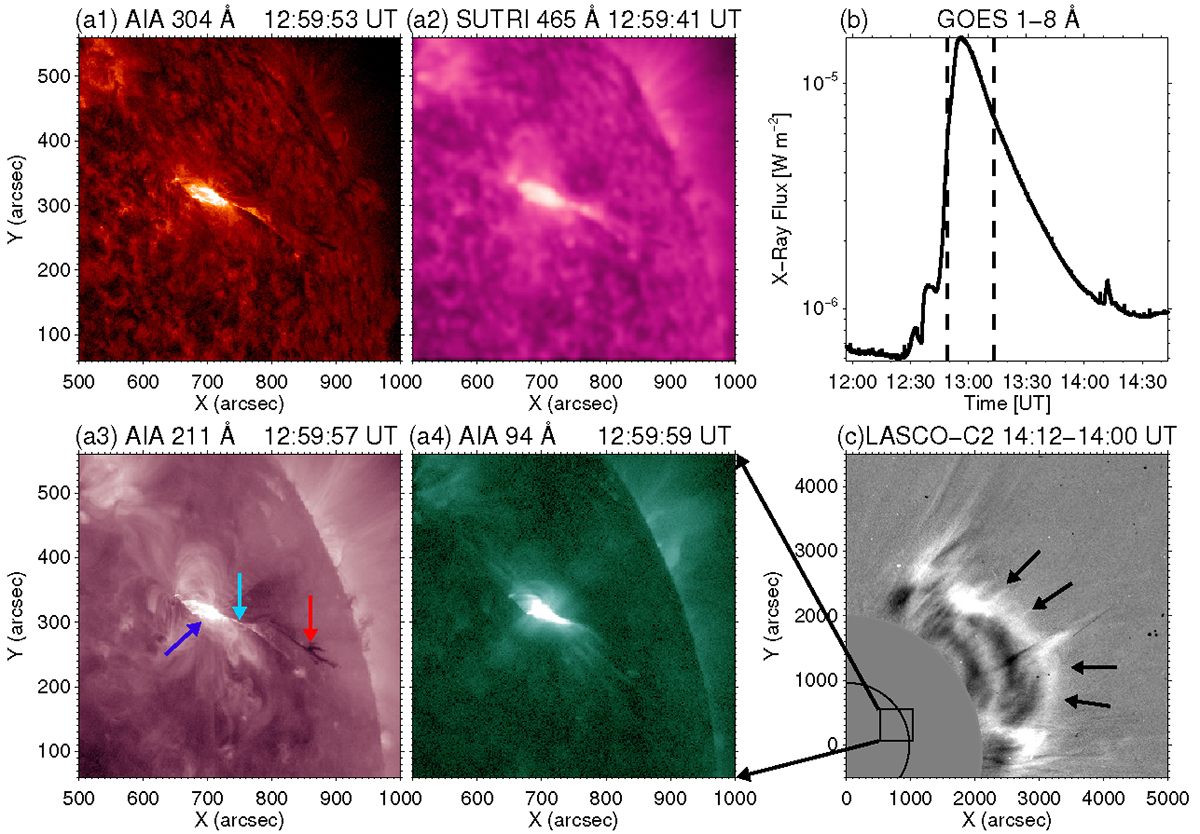
Overview of solar eruption. (a1)–(a4): AIA 304 Å, SUTRI 465 Å, AIA 211 Å, and 94 Å images at ∼13:00:00 UT. In (a3), the blue, cyan, and red arrows mark the flare loops, current sheet, and rising filament, respectively. (b): light curve of GOES X-ray flux at 1−8 Å. The vertical dashed lines indicate the time interval when the current sheet is visible in the EUV images. (c): LASCO C2 difference image between 14:12 UT and 14:00 UT showing the associated CME as marked by the black arrows. The black box indicates the field of view in (a1)–(a4), and the black curve represents the solar limb.
Current usage metrics show cumulative count of Article Views (full-text article views including HTML views, PDF and ePub downloads, according to the available data) and Abstracts Views on Vision4Press platform.
Data correspond to usage on the plateform after 2015. The current usage metrics is available 48-96 hours after online publication and is updated daily on week days.
Initial download of the metrics may take a while.