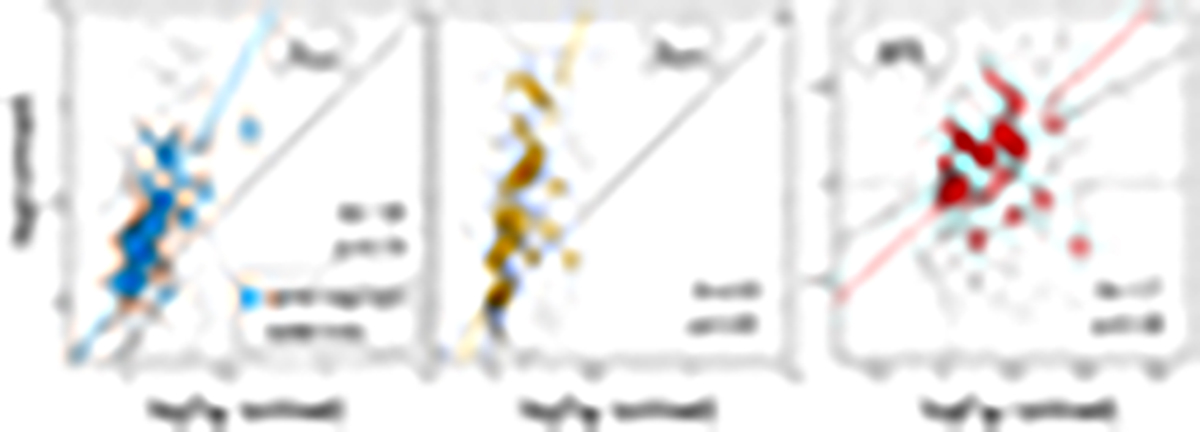
Fig. 5.
Download original image
Arm/interarm molecular gas, SFR, and SFE contrast as a function of stellar mass contrast. The solid black line marks the 1:1 relationship. All radial datapoints are shown as open circles in the background. The coloured solid line indicates the best bisector fit to the coloured circles, which represent the average per spiral segment. The fits are provided in Table F.1, and we list the slope as m inside the plot. The strength of the correlation for the coloured circles is indicated by ρ.
Current usage metrics show cumulative count of Article Views (full-text article views including HTML views, PDF and ePub downloads, according to the available data) and Abstracts Views on Vision4Press platform.
Data correspond to usage on the plateform after 2015. The current usage metrics is available 48-96 hours after online publication and is updated daily on week days.
Initial download of the metrics may take a while.