Fig. 3.
Download original image
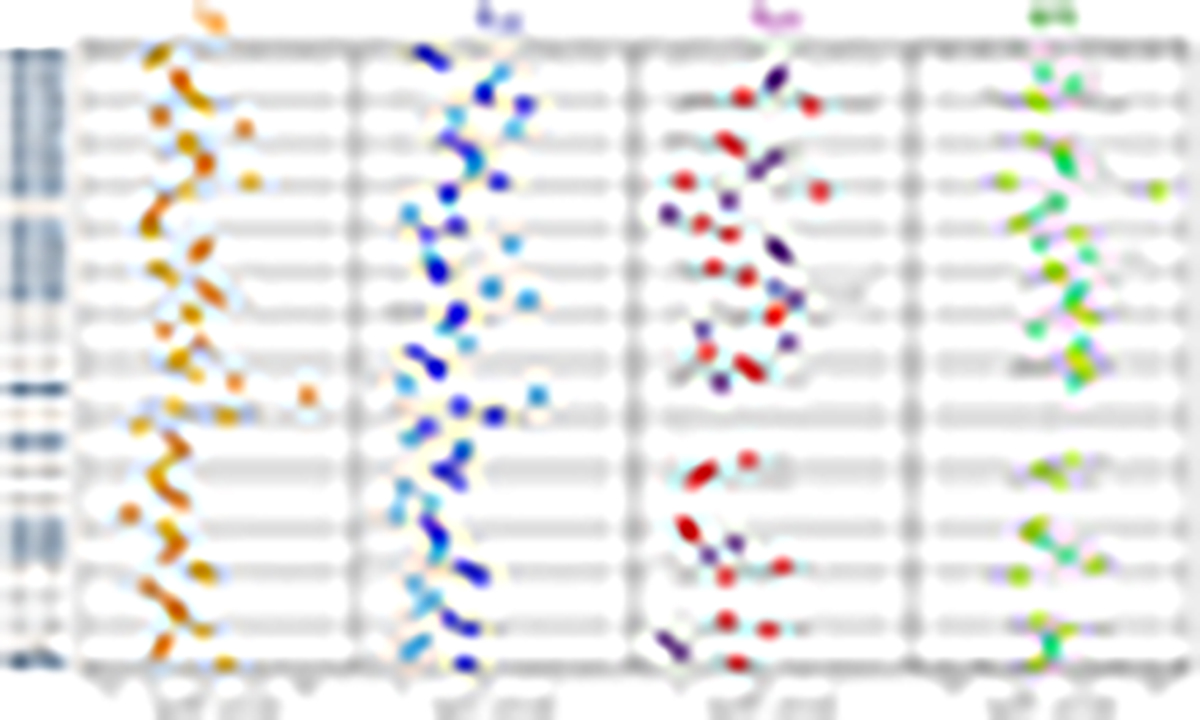
Range of contrasts for each spiral segment per galaxy, ordered by decreasing stellar mass of the host galaxy from top to bottom. The circles indicate the median value along each segment and the error bars extend from the 25th to the 75th percentile. For easier visual differentiation, all spiral segments within a given galaxy have the same colour hue. Grand-design spirals have their names highlighted in pale blue.
Current usage metrics show cumulative count of Article Views (full-text article views including HTML views, PDF and ePub downloads, according to the available data) and Abstracts Views on Vision4Press platform.
Data correspond to usage on the plateform after 2015. The current usage metrics is available 48-96 hours after online publication and is updated daily on week days.
Initial download of the metrics may take a while.