Fig. C.2.
Download original image
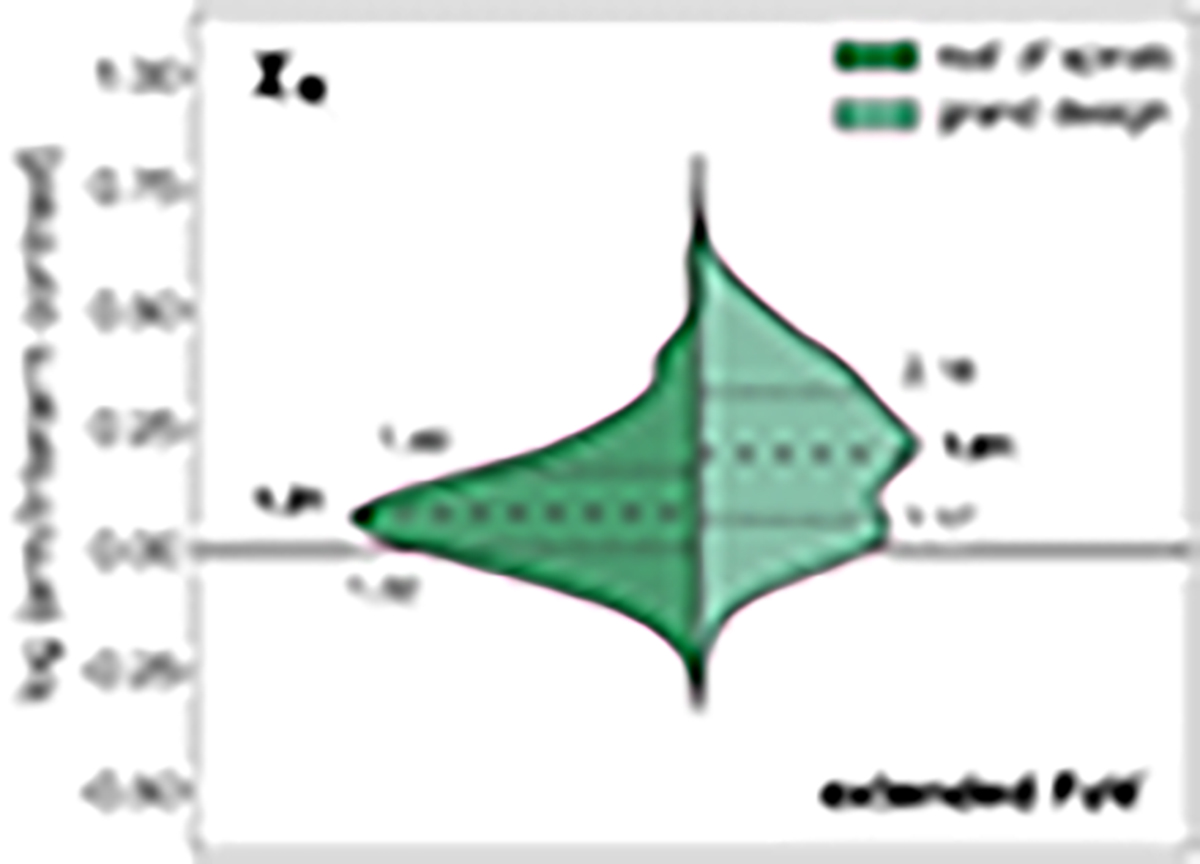
Violin plot showing the distribution of stellar mass arm/interarm contrasts in logarithmic scale for all radial bins across the PHANGS targets, considering an extended field of view (all Σ⋆ measurements across spiral arms, not limited to the PHANGS–ALMA field of view). The violin plots are split into grand-design galaxies (right) and the rest of spirals (left). The long dashed line shows the median of the distribution in each case, while the short dashed lines display the 25th and 75th percentiles of the data, with labels indicating for reference the corresponding values on a linear scale.
Current usage metrics show cumulative count of Article Views (full-text article views including HTML views, PDF and ePub downloads, according to the available data) and Abstracts Views on Vision4Press platform.
Data correspond to usage on the plateform after 2015. The current usage metrics is available 48-96 hours after online publication and is updated daily on week days.
Initial download of the metrics may take a while.