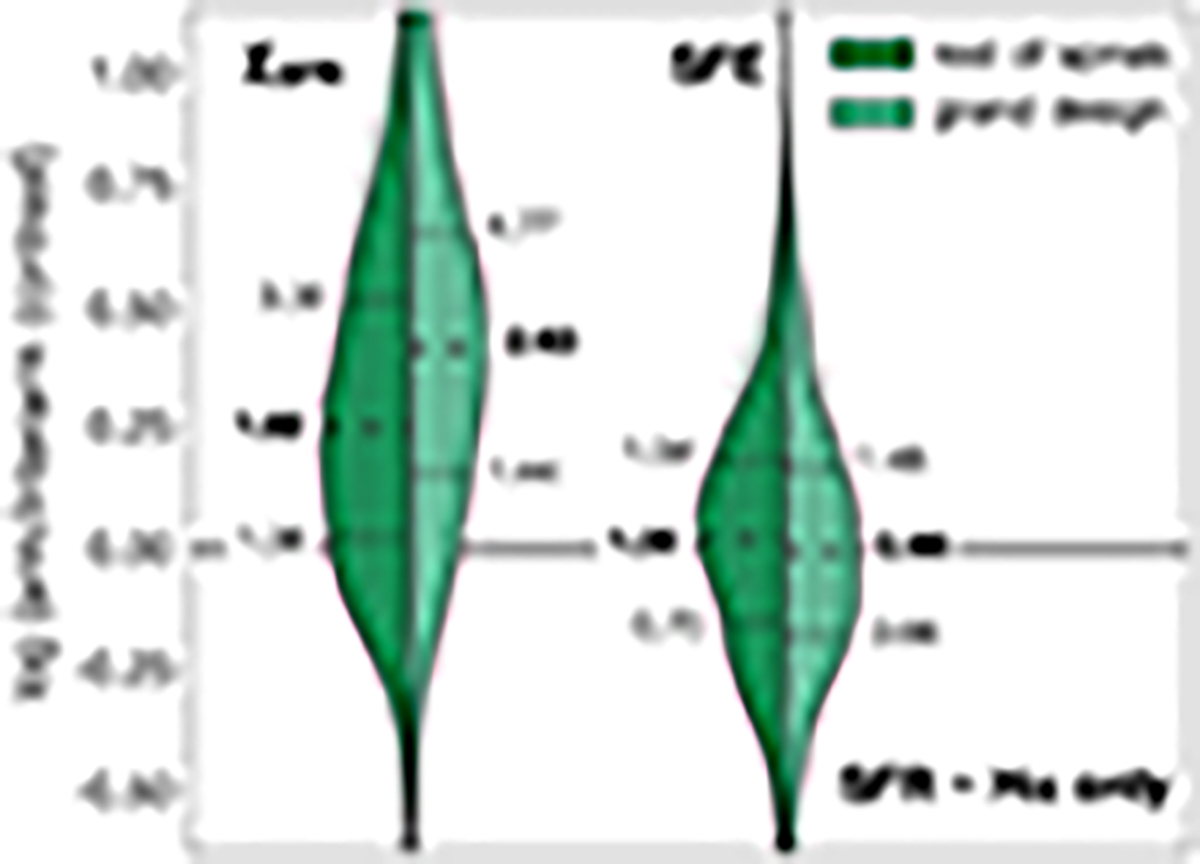
Fig. B.3.
Download original image
Violin plot showing the distribution of SFR and SFE (1/τdep) arm/interarm contrasts in logarithmic scale for all radial bins across the PHANGS targets. As opposed to Fig. 4, here the SFR contrast is calculated directly as the ratio of Hα, without applying any corrections to account for extinction. The equivalent violins following our nominal approach (those from Fig. 4) are shown as translucent in the background for reference; these include the calibration introduced in Sect. B to consider extinction effects. The long dashed line shows the median of the distribution in each case, while the short dashed lines display the 25th and 75th percentiles of the data, with labels indicating for reference the corresponding values on a linear scale.
Current usage metrics show cumulative count of Article Views (full-text article views including HTML views, PDF and ePub downloads, according to the available data) and Abstracts Views on Vision4Press platform.
Data correspond to usage on the plateform after 2015. The current usage metrics is available 48-96 hours after online publication and is updated daily on week days.
Initial download of the metrics may take a while.