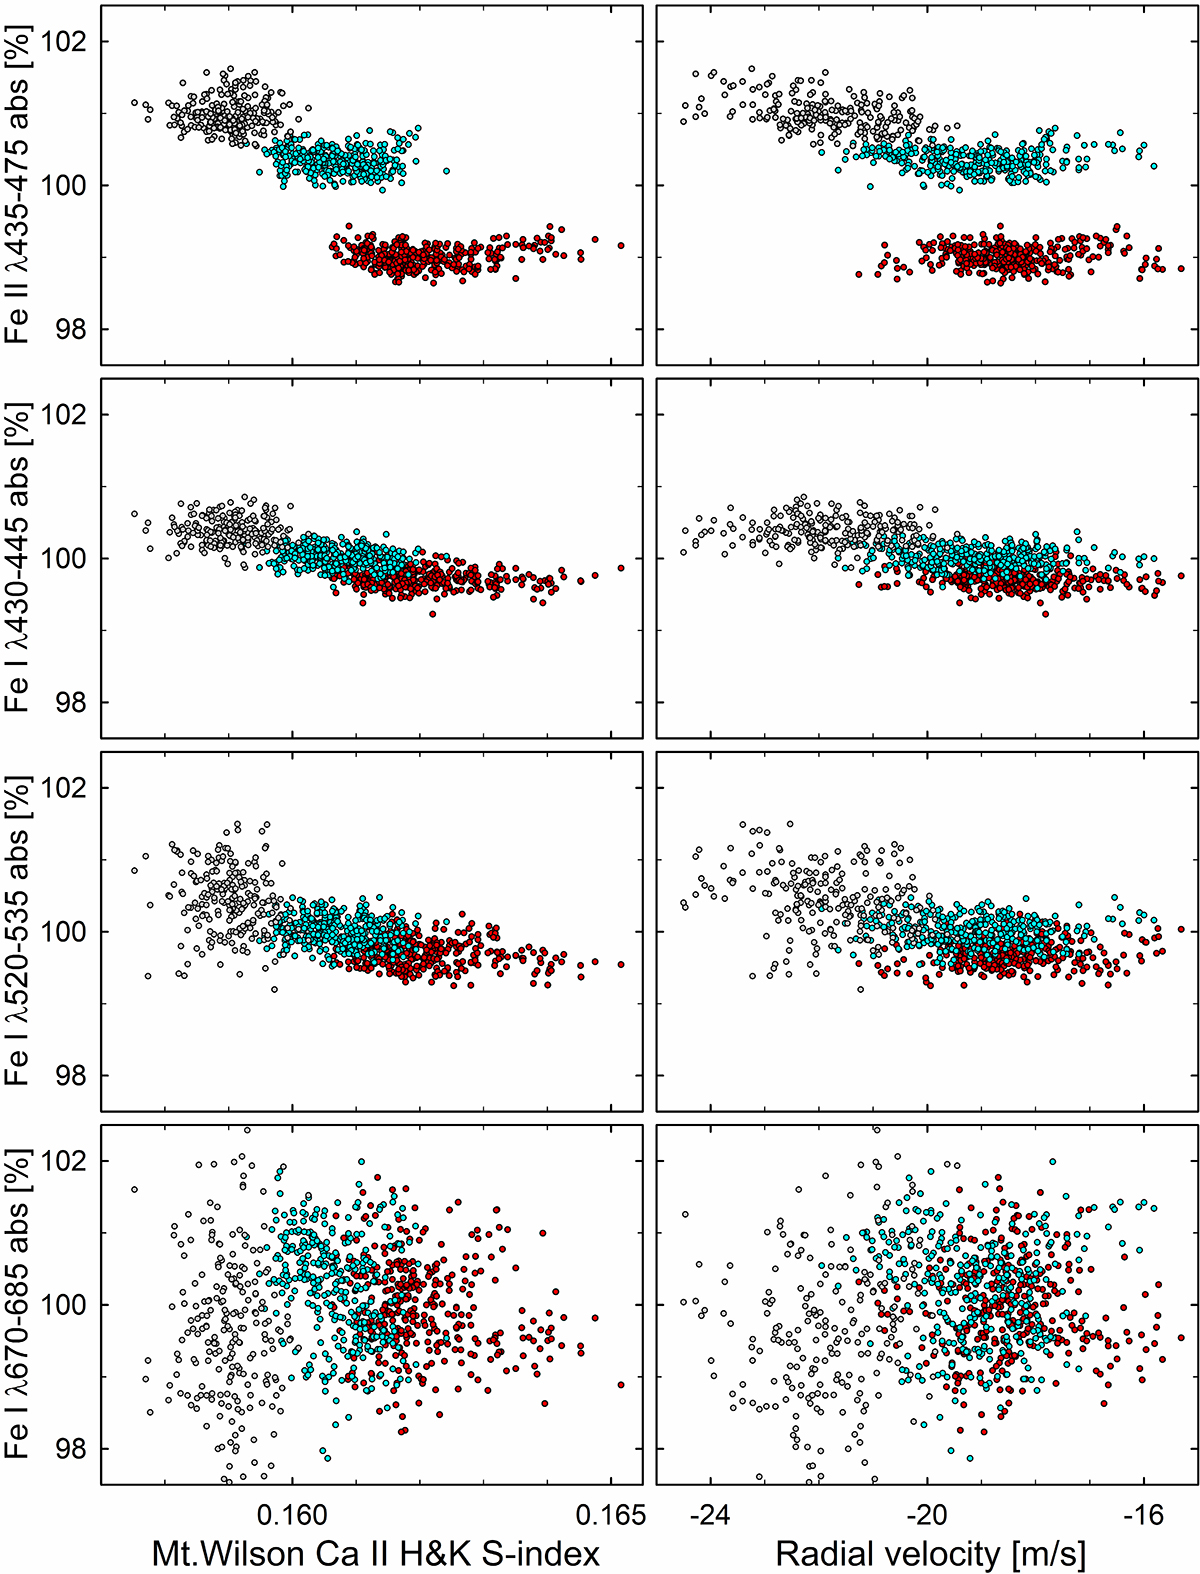
Fig. 6.
Download original image
Relative changes of Fe I and Fe II absorption line equivalent widths during the measured periods in 2016 (red), 2017 (cyan), and 2018 (gray). Left column shows the dependence on the Mt.Wilson Ca II H & K chromospheric activity S-index; right column on the radial velocity as obtained from the full HARPS-N spectrum. A lower S/N in the grating orders housing weaker lines at the longest wavelengths accounts for a greater spread of points in the bottom frames. The lines included in each group are listed in Table B.1.
Current usage metrics show cumulative count of Article Views (full-text article views including HTML views, PDF and ePub downloads, according to the available data) and Abstracts Views on Vision4Press platform.
Data correspond to usage on the plateform after 2015. The current usage metrics is available 48-96 hours after online publication and is updated daily on week days.
Initial download of the metrics may take a while.