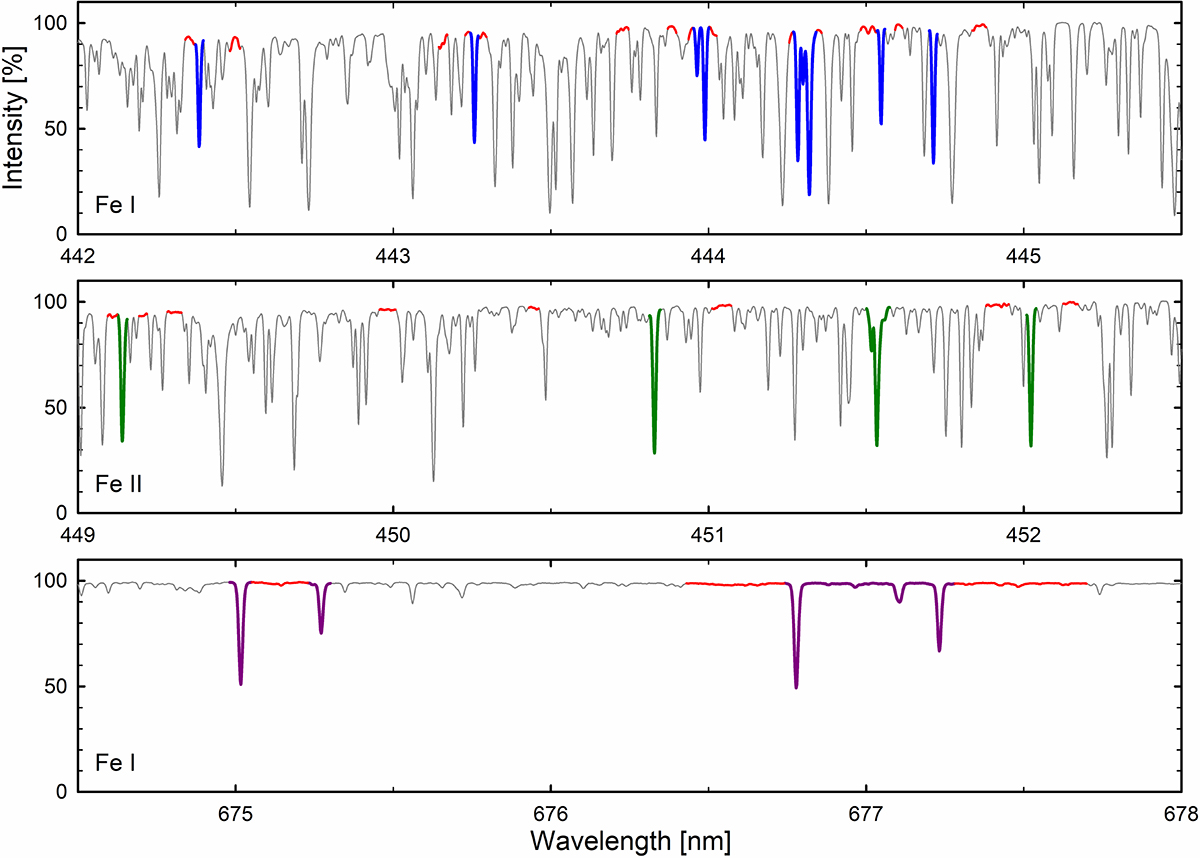
Fig. 5.
Download original image
Example of Fe I line selections in shortward parts of the spectrum (blue), of Fe II (green), and of Fe I at long wavelengths (dark purple). Absorption features are truncated at places of small intensity gradients, occasionally embracing several lines. Intermingled pseudocontinua, whose averages are used as an intensity reference, are marked in red.
Current usage metrics show cumulative count of Article Views (full-text article views including HTML views, PDF and ePub downloads, according to the available data) and Abstracts Views on Vision4Press platform.
Data correspond to usage on the plateform after 2015. The current usage metrics is available 48-96 hours after online publication and is updated daily on week days.
Initial download of the metrics may take a while.