Fig. 4.
Download original image
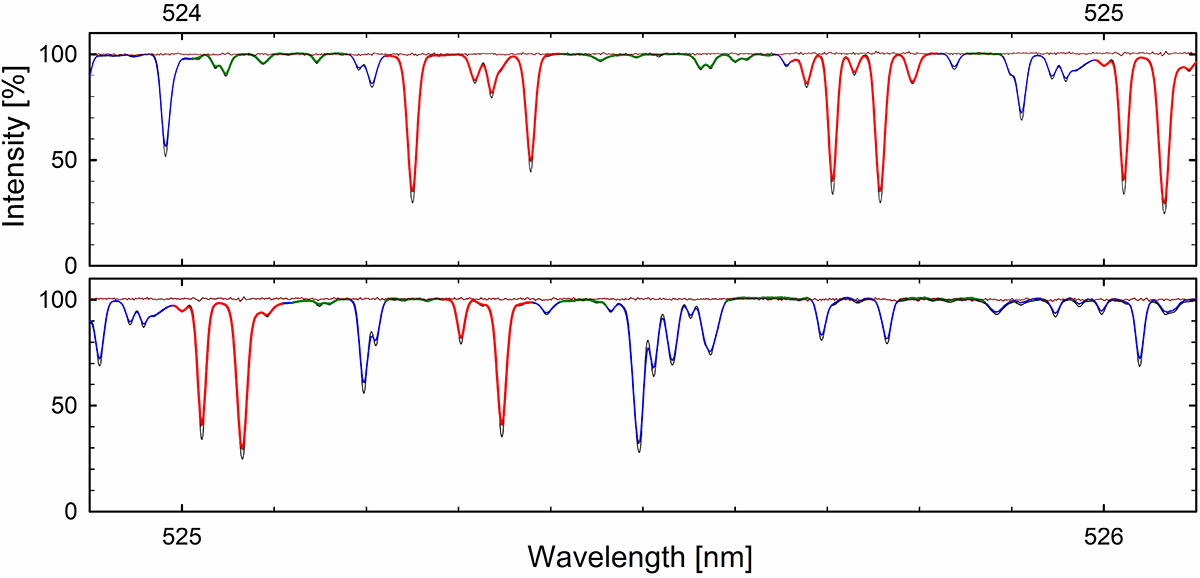
Example of HARPS-N spectra and selection of regions for measurement. Background thin black line: Göttingen solar flux atlas (Reiners et al. 2016). Its higher spectral resolution is evident from its deeper line profiles. Blue line: Average over 100 HARPS-N exposures. Red line: Selected regions of Fe I line absorption. Green line: Selected reference regions of quasi-continua. Thin brown line around 100%: ratio between one representative HARPS-N exposure and a 100-exposure average, illustrating the random-noise level for a single exposure with nominal S/N in grating order 50 equal to 430. The wavelength scale represents values in air (vacuum values in the Göttingen atlas were converted to those in standard air).
Current usage metrics show cumulative count of Article Views (full-text article views including HTML views, PDF and ePub downloads, according to the available data) and Abstracts Views on Vision4Press platform.
Data correspond to usage on the plateform after 2015. The current usage metrics is available 48-96 hours after online publication and is updated daily on week days.
Initial download of the metrics may take a while.