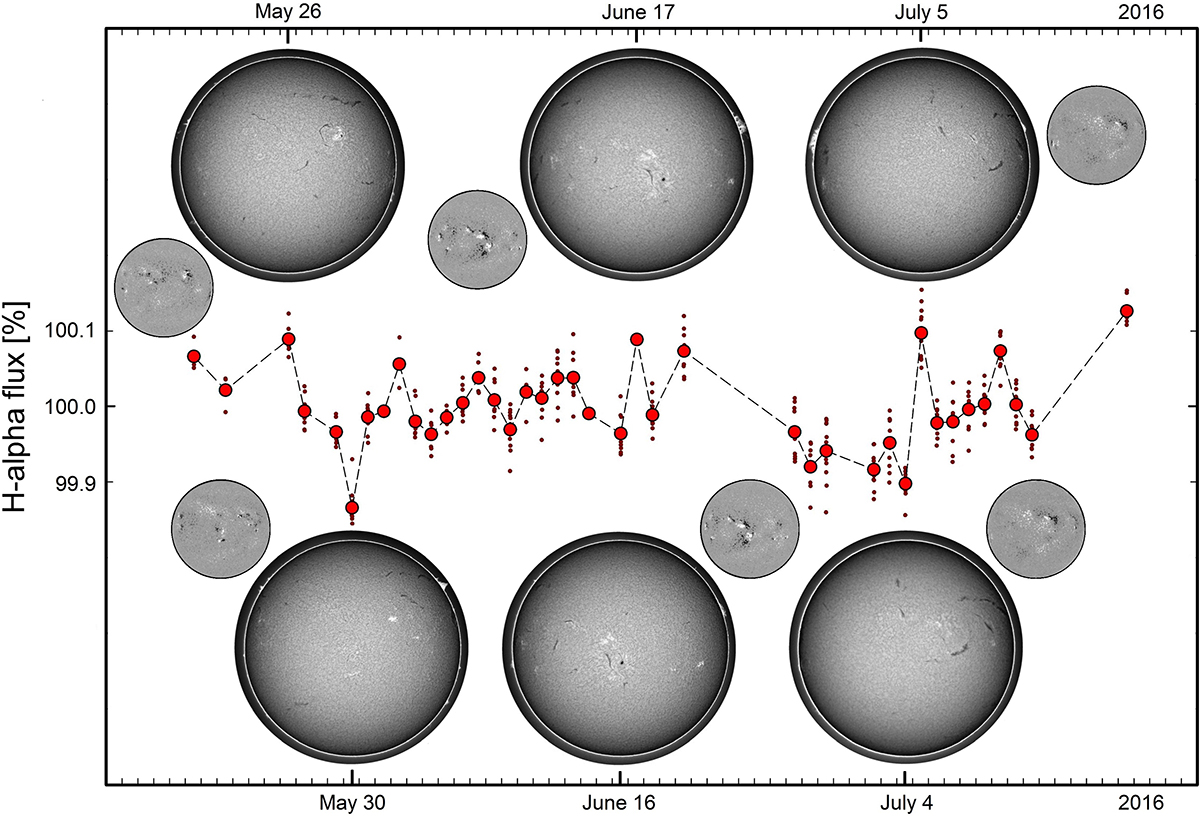
Fig. 21.
Download original image
Variations in Hα flux (not absorption) measured during the 2016 data period, together with contemporaneous full-disk Hα images and (adjacent smaller circles) photospheric magnetograms, at selected labeled dates of local Hα-flux maxima or minima. Daily Hα flux averages are large red dots, individual exposures are small and black. The full-disk images were acquired by GONG instruments operated by NISP/NSO/AURA/NSF with contributions from NOAA (Global Oscillation Network Group 2024).
Current usage metrics show cumulative count of Article Views (full-text article views including HTML views, PDF and ePub downloads, according to the available data) and Abstracts Views on Vision4Press platform.
Data correspond to usage on the plateform after 2015. The current usage metrics is available 48-96 hours after online publication and is updated daily on week days.
Initial download of the metrics may take a while.