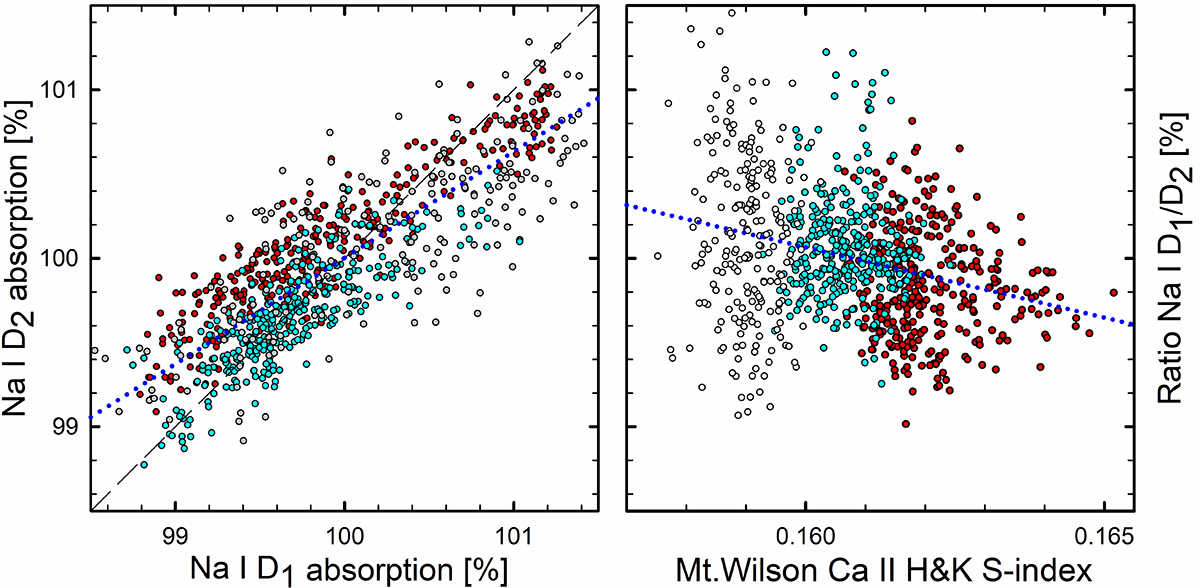
Fig. 20.
Download original image
Differential variability of absorption in Na I D1 and D2 lines. The observing seasons of 2016, 2017, and 2018 are marked in red, cyan, and gray. The identity relation is dashed while linear fits are dotted blue. The weaker Na I D1 line is more variable than the more saturated D2, while their ratio mirrors the chromospheric activity index.
Current usage metrics show cumulative count of Article Views (full-text article views including HTML views, PDF and ePub downloads, according to the available data) and Abstracts Views on Vision4Press platform.
Data correspond to usage on the plateform after 2015. The current usage metrics is available 48-96 hours after online publication and is updated daily on week days.
Initial download of the metrics may take a while.