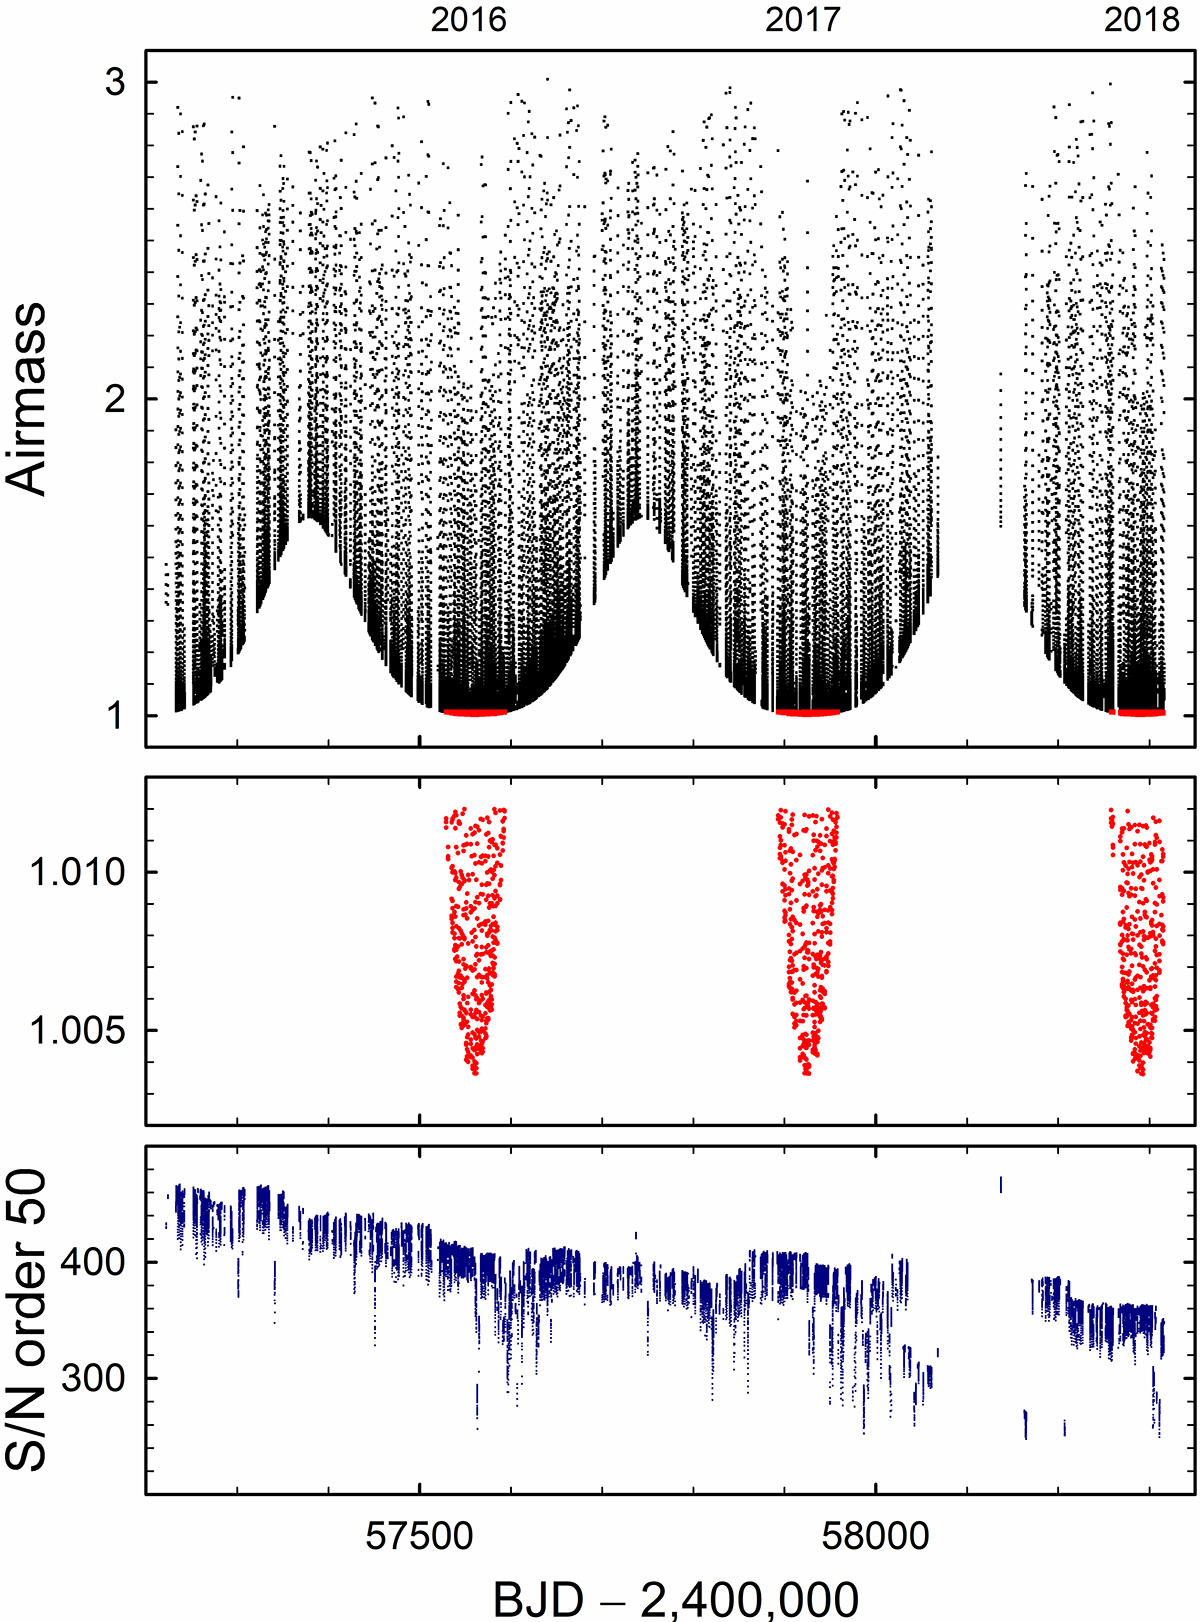
Fig. 2.
Download original image
HARPS-N observations of the Sun (top) with each exposure marked by a point (Dumusque et al. 2021). Selected exposures at the smallest airmasses (red points) occurred around daily noon during the summer seasons of 2016–2017–2018. Airmasses for the 1000 selected recordings (middle). S/N values remaining very high, but decreasing slightly over time (bottom), apparently due to diminishing telescope and instrument transmission.
Current usage metrics show cumulative count of Article Views (full-text article views including HTML views, PDF and ePub downloads, according to the available data) and Abstracts Views on Vision4Press platform.
Data correspond to usage on the plateform after 2015. The current usage metrics is available 48-96 hours after online publication and is updated daily on week days.
Initial download of the metrics may take a while.