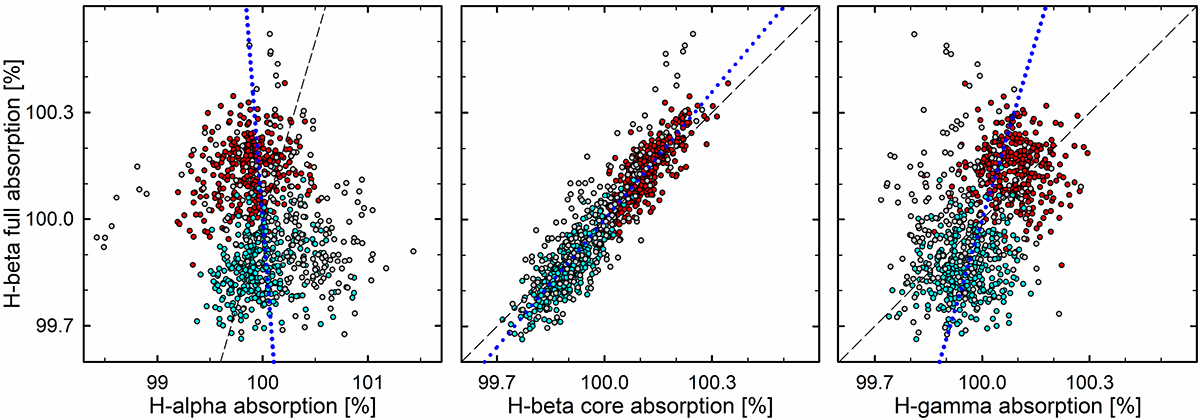
Fig. 18.
Download original image
Ratios of the absorption equivalent widths for the Balmer lines Hα, the Hβ core, and Hγ, versus that of the full Hβ (Fig. 16). Red, cyan, and gray indicate data from the observing seasons of 2016, 2017, and 2018. Dashed lines show the identity ratios while those in dotted blue are fits to the data. Because of its greater variability, the horizontal scale for Hα is more extended.
Current usage metrics show cumulative count of Article Views (full-text article views including HTML views, PDF and ePub downloads, according to the available data) and Abstracts Views on Vision4Press platform.
Data correspond to usage on the plateform after 2015. The current usage metrics is available 48-96 hours after online publication and is updated daily on week days.
Initial download of the metrics may take a while.