Fig. 16.
Download original image
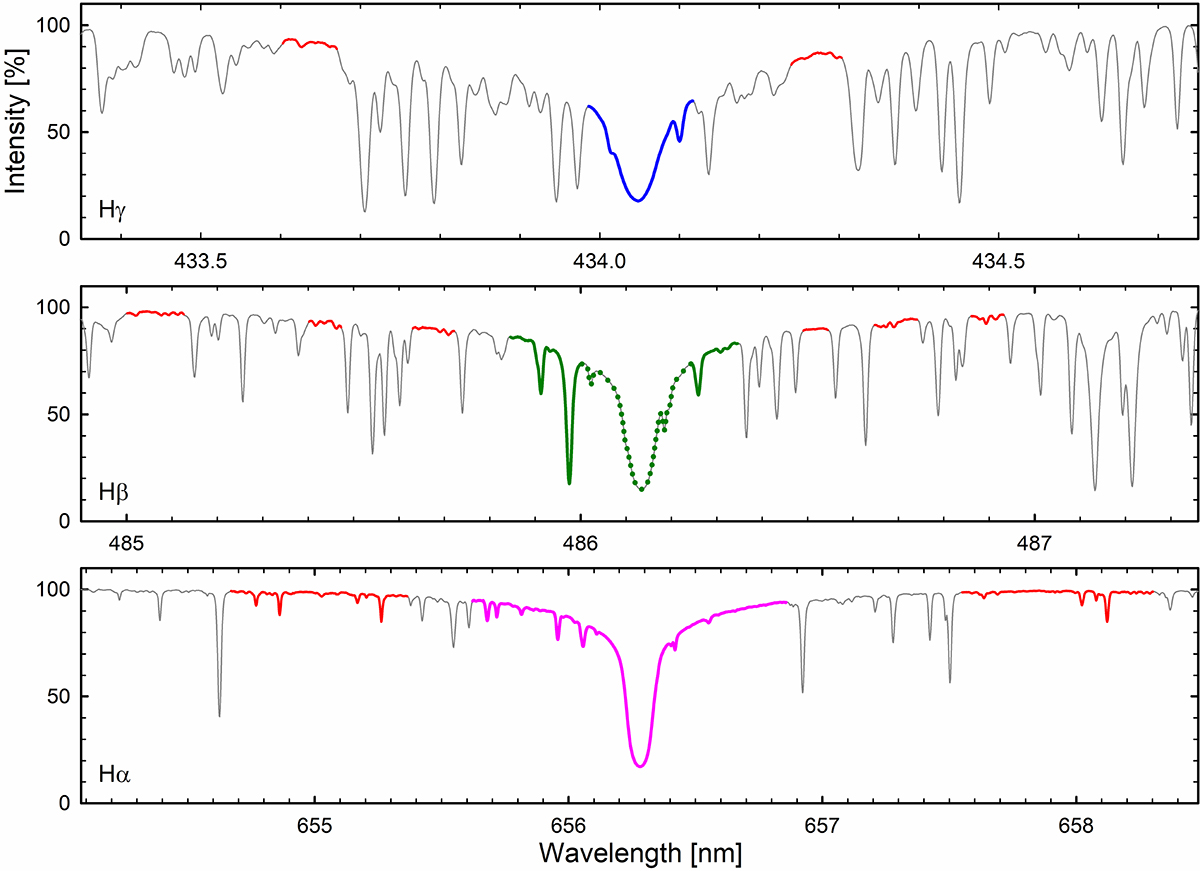
Spectral regions around Hα, Hβ, and Hγ. Solid bold lines denote the line intervals measured; for Hβ its central core was also measured separately (dotted). In each case, lines are measured relative to local pseudocontinua marked in red, chosen symmetrically about the line centers. The average spectrum from 100 HARPS-N exposures is plotted as a thin dark line. The intensities are normalized to each local pseudocontinuum.
Current usage metrics show cumulative count of Article Views (full-text article views including HTML views, PDF and ePub downloads, according to the available data) and Abstracts Views on Vision4Press platform.
Data correspond to usage on the plateform after 2015. The current usage metrics is available 48-96 hours after online publication and is updated daily on week days.
Initial download of the metrics may take a while.