Fig. 13.
Download original image
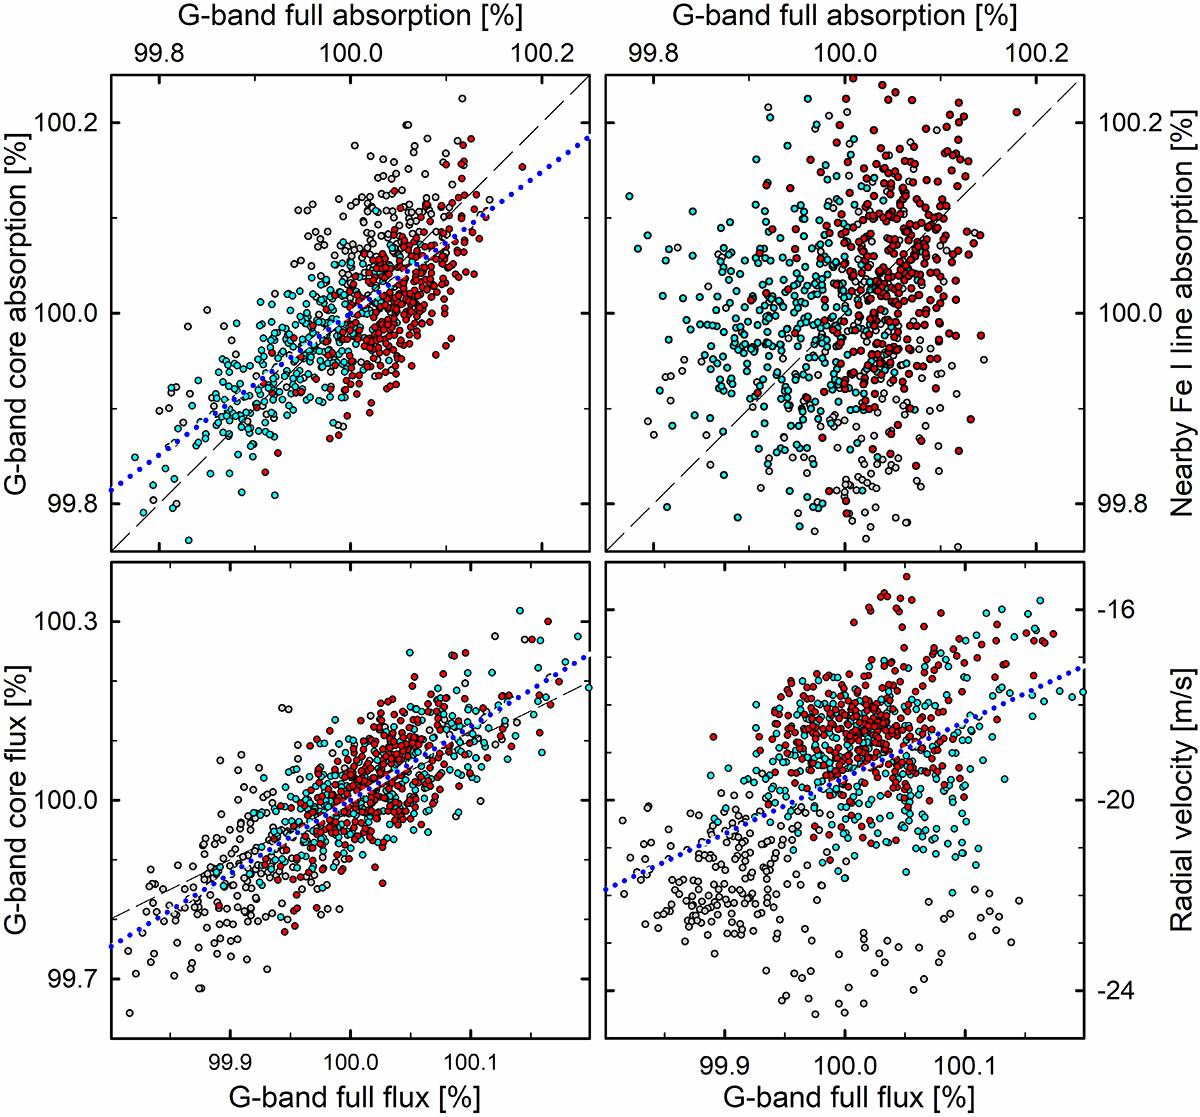
Ratios between the full G-band fluxes and its absorption equivalent widths, the G-band core, and that of nearby Fe I lines. Different seasons of 2016, 2017, and 2018 are marked in red, cyan, and gray. Fitted relations are dotted blue lines, while the identity relations are dashed black. The core flux shows a steeper relative variability than the full band.
Current usage metrics show cumulative count of Article Views (full-text article views including HTML views, PDF and ePub downloads, according to the available data) and Abstracts Views on Vision4Press platform.
Data correspond to usage on the plateform after 2015. The current usage metrics is available 48-96 hours after online publication and is updated daily on week days.
Initial download of the metrics may take a while.