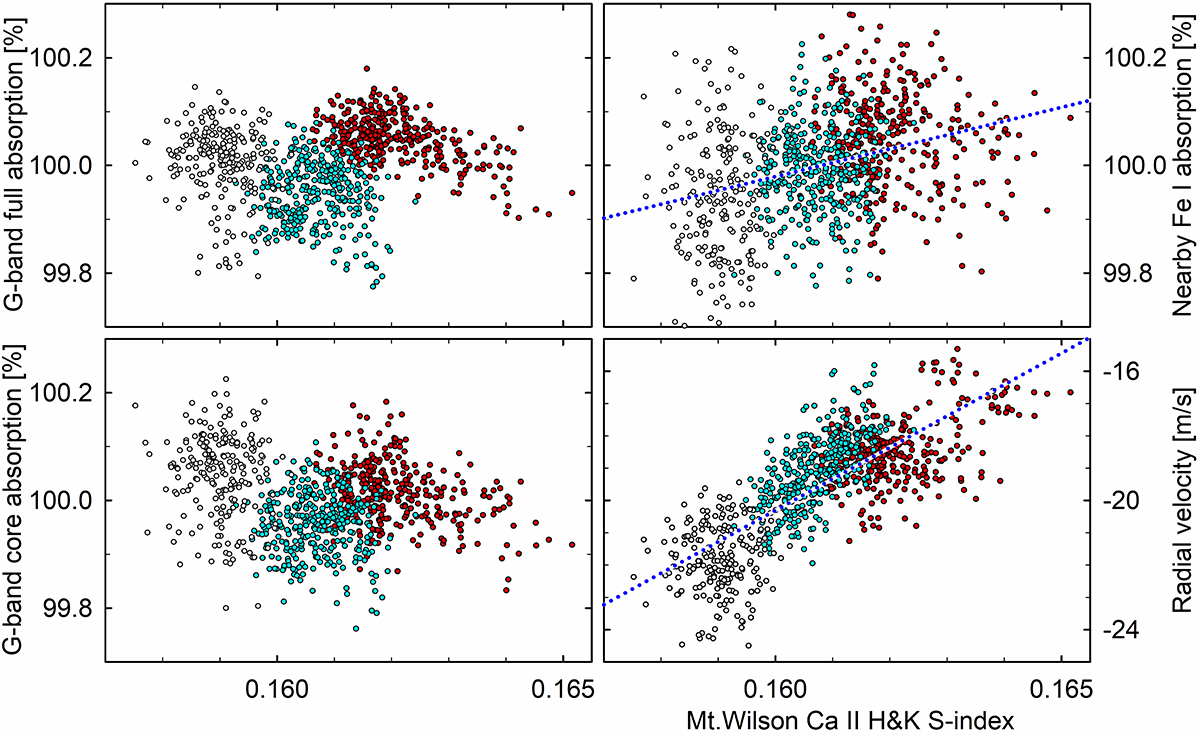
Fig. 12.
Download original image
Absorption equivalent widths for the full G-band region, its central core, and nearby Fe I lines, as function of the Ca II H & K S-index. The different seasons of 2016, 2017, and 2018 are marked in red, cyan, and gray. Also, the corresponding radial velocity variations for the full spectrum are shown. For cases with apparent systematic dependences, dotted blue lines show fitted relations.
Current usage metrics show cumulative count of Article Views (full-text article views including HTML views, PDF and ePub downloads, according to the available data) and Abstracts Views on Vision4Press platform.
Data correspond to usage on the plateform after 2015. The current usage metrics is available 48-96 hours after online publication and is updated daily on week days.
Initial download of the metrics may take a while.