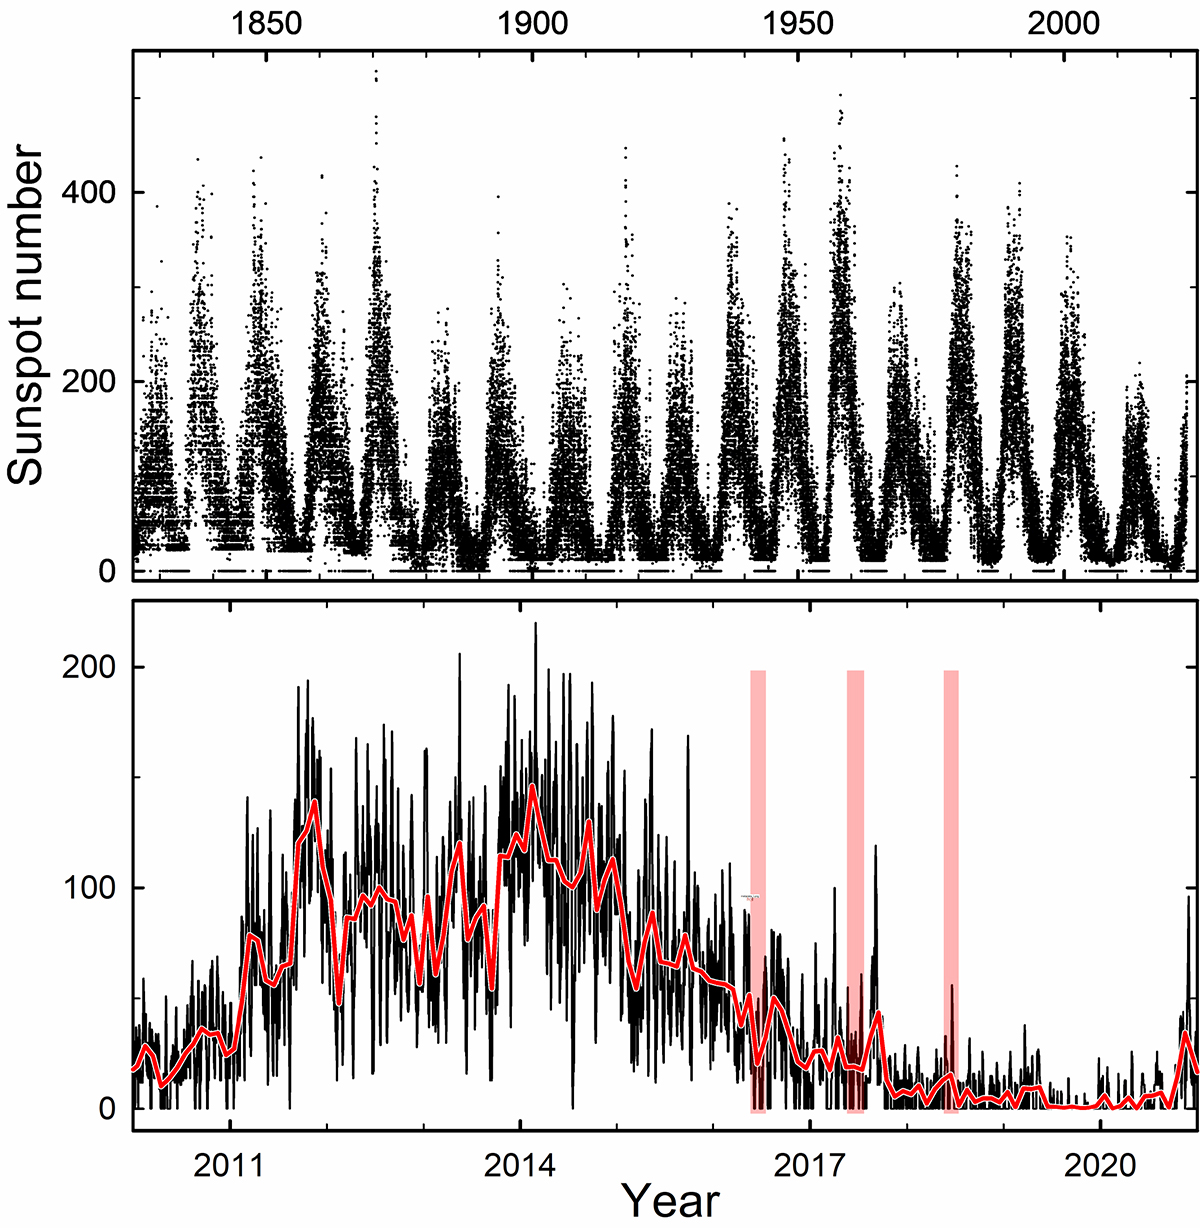
Fig. 1.
Download original image
200-yr span of sunspot numbers places current observations in a wider perspective (top). Around activity minima, days without reported sunspots are not unusual. Recent Cycle 24 with daily sunspot numbers (bottom) from WDC-SILSO (World Data Center – Sunspot Index and Long-term Solar Observations, Royal Observatory of Belgium, Brussels). Superposed red curve shows monthly averages. The selected periods from which HARPS-N data were analyzed are marked with vertical bars.
Current usage metrics show cumulative count of Article Views (full-text article views including HTML views, PDF and ePub downloads, according to the available data) and Abstracts Views on Vision4Press platform.
Data correspond to usage on the plateform after 2015. The current usage metrics is available 48-96 hours after online publication and is updated daily on week days.
Initial download of the metrics may take a while.