Fig. 1
Download original image
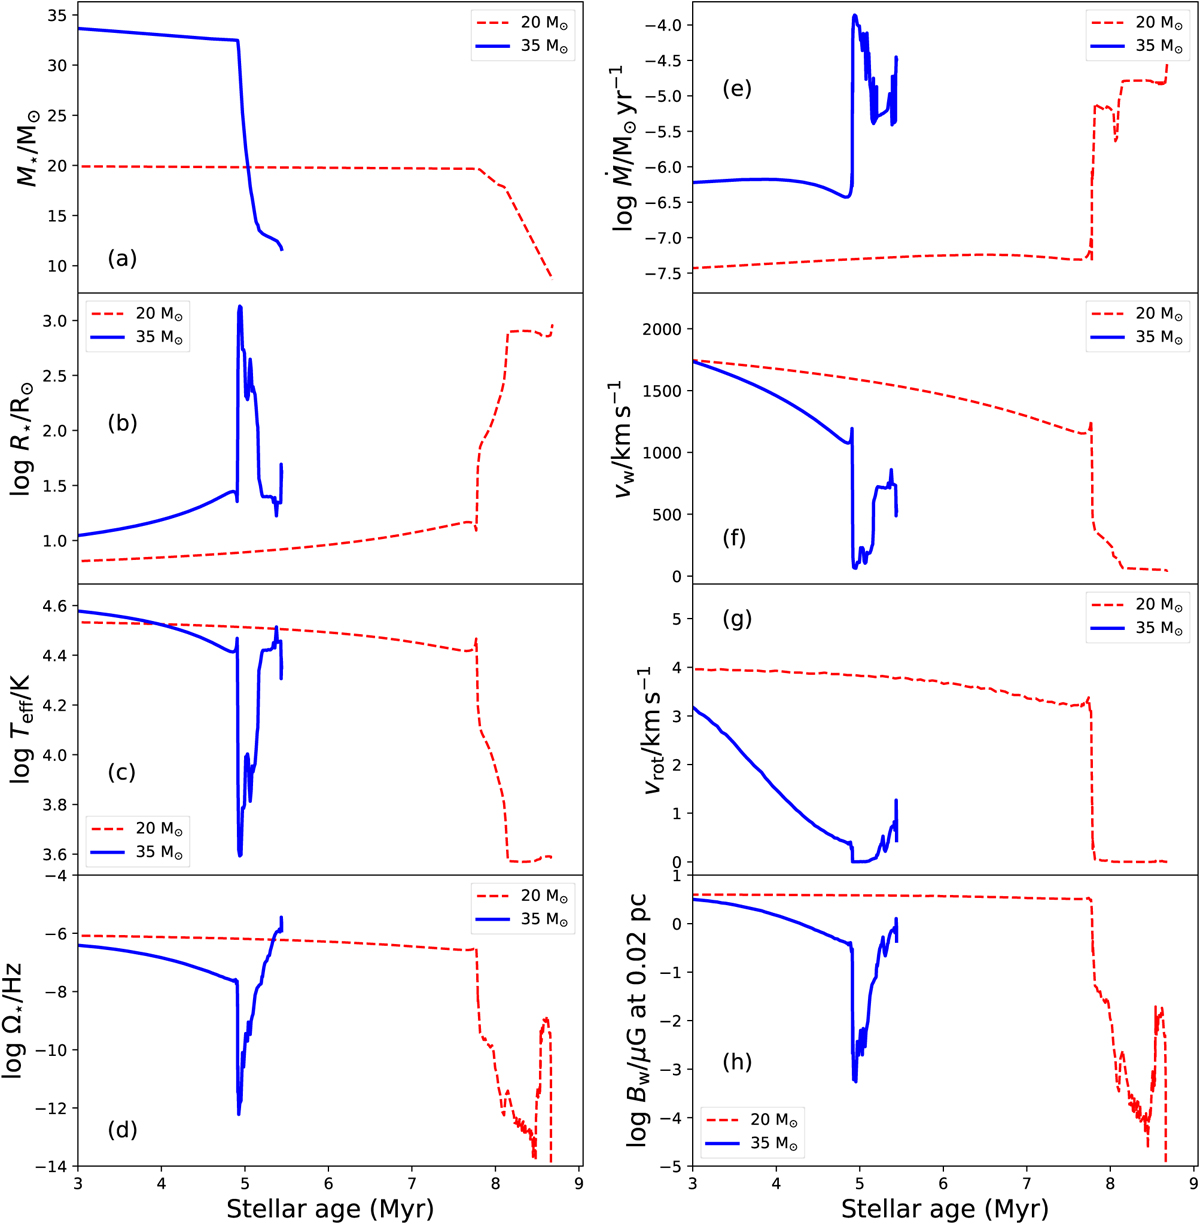
Temporal evolution (in Myr) of the supernova progenitors of ZAMS 20 M⊙ (dotted red line) and 35 M⊙ (solid blue line) considered in our study. The panels display the stellar mass M⋆ (panel a, in M⊙), radius R⋆ (panel b, in R⊙), effective temperature Teff (panel c, in K), angular frequency at the surface Ω⋆ (panel d, in Hz), mass-loss rate Ṁ (panel e, in M⊙ yr−1), wind velocity vw (panel f, in km s−1), equatorial rotation velocity vrot (panel g, in km s−1), and the magnetic field in the wind at 0.02 pc B⋆ (panel h, in µG).
Current usage metrics show cumulative count of Article Views (full-text article views including HTML views, PDF and ePub downloads, according to the available data) and Abstracts Views on Vision4Press platform.
Data correspond to usage on the plateform after 2015. The current usage metrics is available 48-96 hours after online publication and is updated daily on week days.
Initial download of the metrics may take a while.