Fig. C.1
Download original image
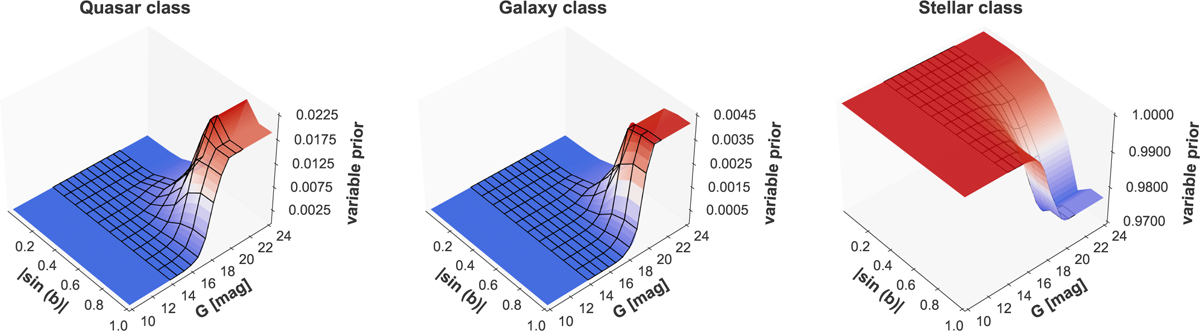
Representation of the variable prior for the quasar, galaxy, and stellar classes. For visualisation, the viewing angle is adapted to distinguish regions of interest in the mapping. The x-axis and y-axis refer to the Galactic latitude and brightness, and the z-axis reports to the prior. The grid corresponds to the discretised 10×10 definition of the prior. The coloured surface represents the fitted spline expanding outside of the boundaries of the grid. The colour scheme is defined such that red colours refer to higher values and blue colours to lower values. Left to right, are represented the priors for the quasar, galaxy, and star classes.
Current usage metrics show cumulative count of Article Views (full-text article views including HTML views, PDF and ePub downloads, according to the available data) and Abstracts Views on Vision4Press platform.
Data correspond to usage on the plateform after 2015. The current usage metrics is available 48-96 hours after online publication and is updated daily on week days.
Initial download of the metrics may take a while.