Fig. 1
Download original image
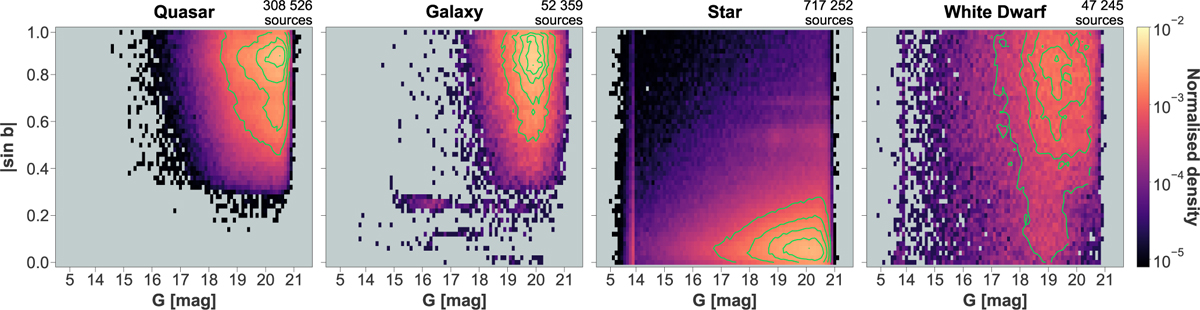
Representation in 2D of the distribution of sources as a function of Galactic latitude and brightness of the original validation data set. Each distribution is normalised by the total number of sources in that panel. The colour scale is set such that bright colours indicate a higher density of sources compared to dark regions. The 2D representation of the density of sources is defined on a grid in | sin b| and G of 50×91 bins. As a design choice, the binning in magnitude bins compresses the range at G<14. Contours (green lines) are used in the regions of highest density to indicate the normalised density in log scale.
Current usage metrics show cumulative count of Article Views (full-text article views including HTML views, PDF and ePub downloads, according to the available data) and Abstracts Views on Vision4Press platform.
Data correspond to usage on the plateform after 2015. The current usage metrics is available 48-96 hours after online publication and is updated daily on week days.
Initial download of the metrics may take a while.