Fig. 3.
Download original image
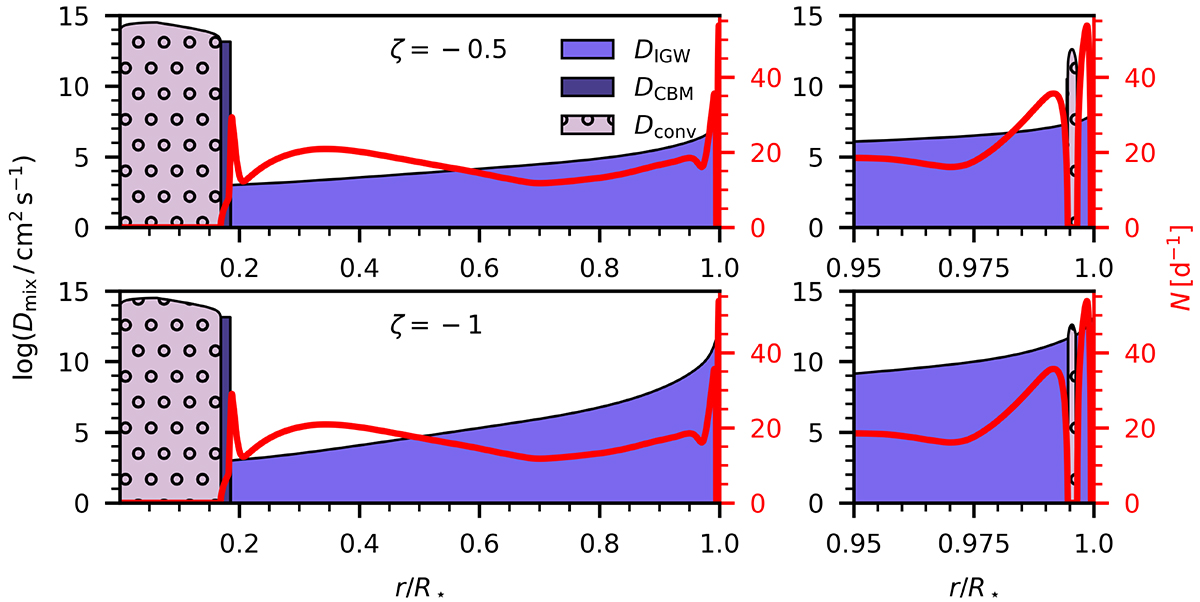
Variation of the chemical diffusion coefficient as a function of the radial coordinate throughout the star (4 M⊙, Zini = 0.014, log D0 = 3, Xc = 0.66). Different types of mixing regions are indicated. The top panel corresponds to setting ζ = −0.5 in Eq. (1), the bottom panel to setting ζ = −1. The graphs in red show the corresponding profile of the Brunt–Väisälä frequency (N). The right column shows zoom-ins of the outermost five per cent of the radius.
Current usage metrics show cumulative count of Article Views (full-text article views including HTML views, PDF and ePub downloads, according to the available data) and Abstracts Views on Vision4Press platform.
Data correspond to usage on the plateform after 2015. The current usage metrics is available 48-96 hours after online publication and is updated daily on week days.
Initial download of the metrics may take a while.