Open Access
Fig. 7
Download original image
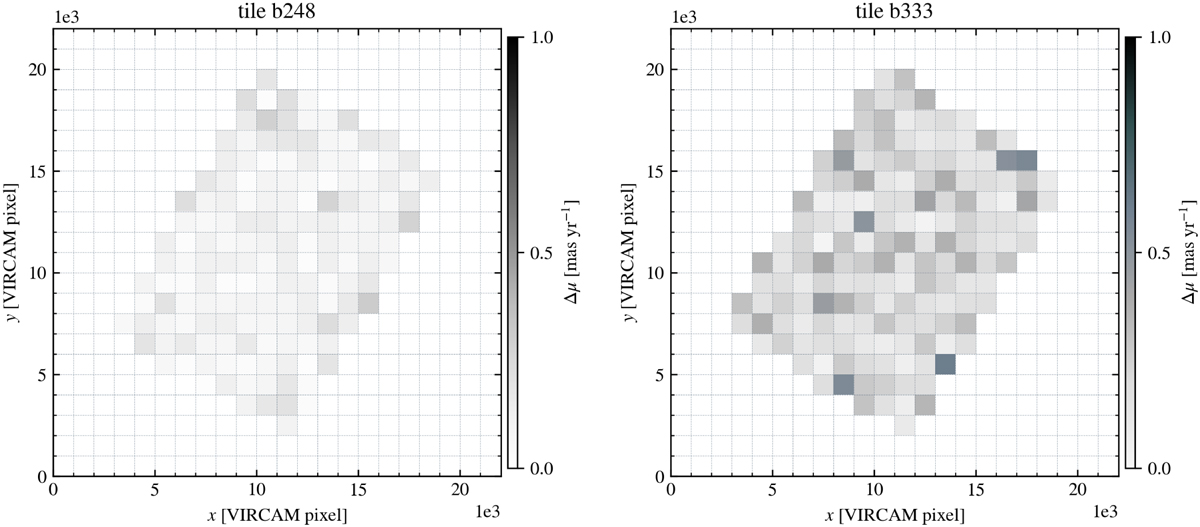
Similar to Fig. 6, but as a function of position for tile b248 (left) and tile b333 (right). Each region is colored according to the 3σ-clipped median value of the absolute deviation between Gaia’s and our proper motions, according to the color bars on the right of each panel.
Current usage metrics show cumulative count of Article Views (full-text article views including HTML views, PDF and ePub downloads, according to the available data) and Abstracts Views on Vision4Press platform.
Data correspond to usage on the plateform after 2015. The current usage metrics is available 48-96 hours after online publication and is updated daily on week days.
Initial download of the metrics may take a while.