Open Access
Fig. 5
Download original image
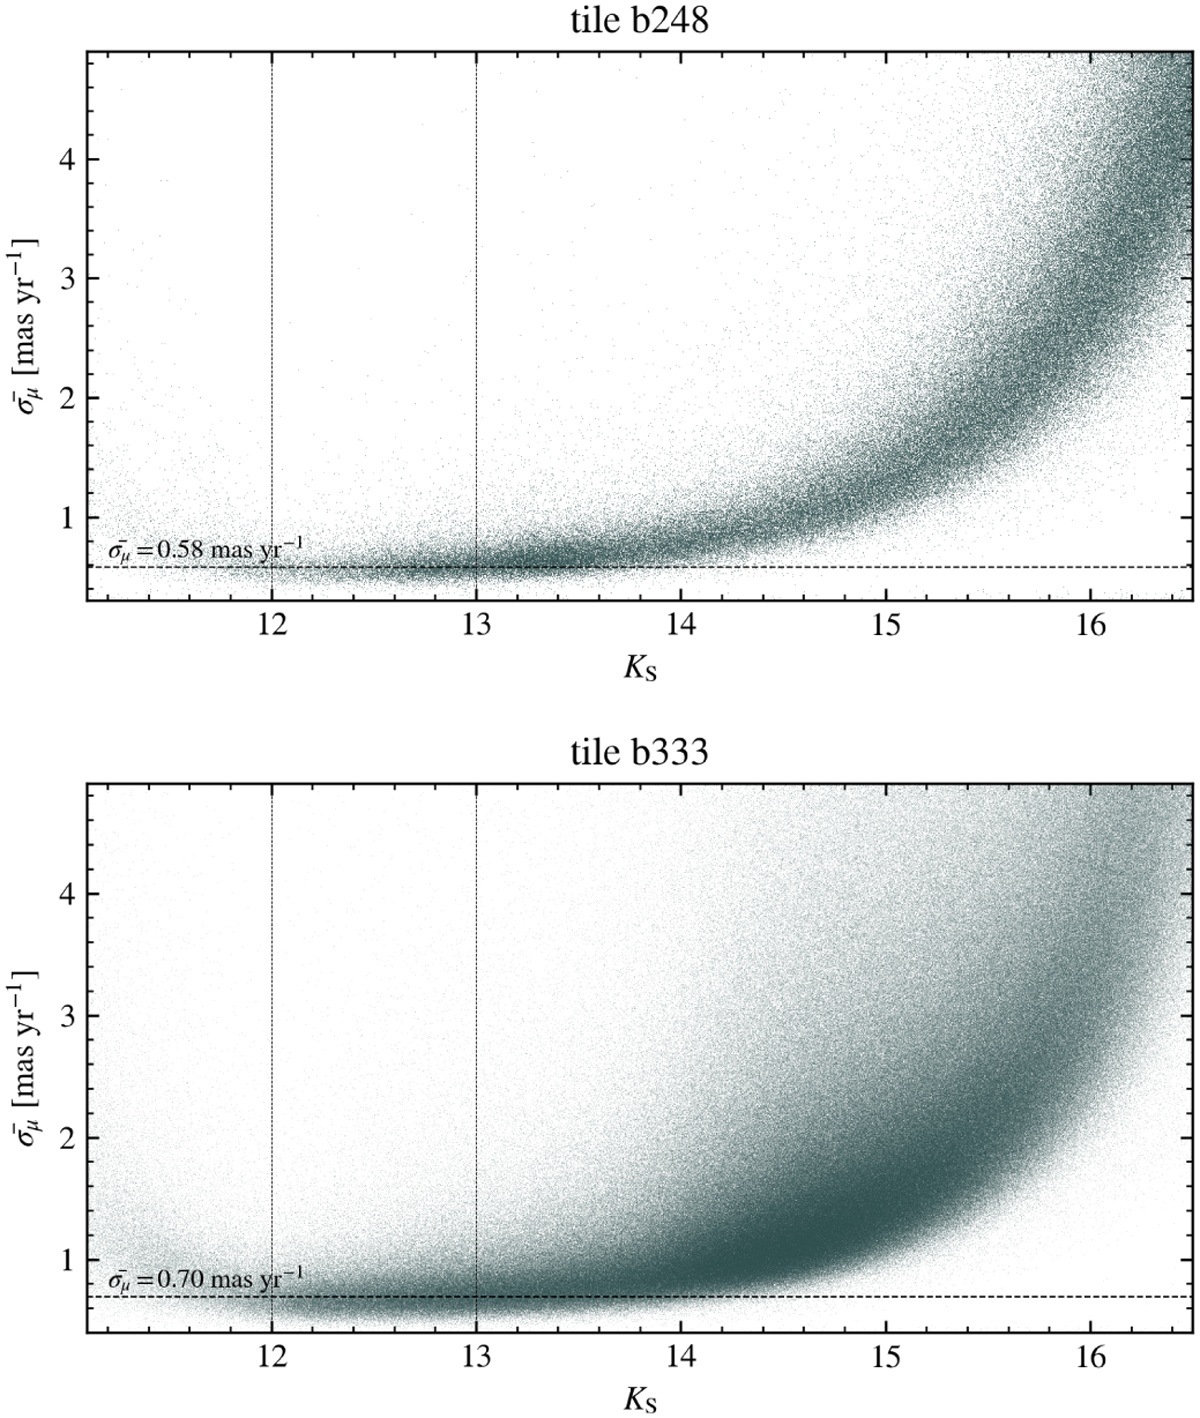
Mean proper-motion errors for sources in tile b248 (top) and tile b333 (bottom) as a function of the KS magnitude. The horizontal line represents the median error of the sources in the range 12 < KS < 13 (see the text for details).
Current usage metrics show cumulative count of Article Views (full-text article views including HTML views, PDF and ePub downloads, according to the available data) and Abstracts Views on Vision4Press platform.
Data correspond to usage on the plateform after 2015. The current usage metrics is available 48-96 hours after online publication and is updated daily on week days.
Initial download of the metrics may take a while.