Open Access
Fig. 1
Download original image
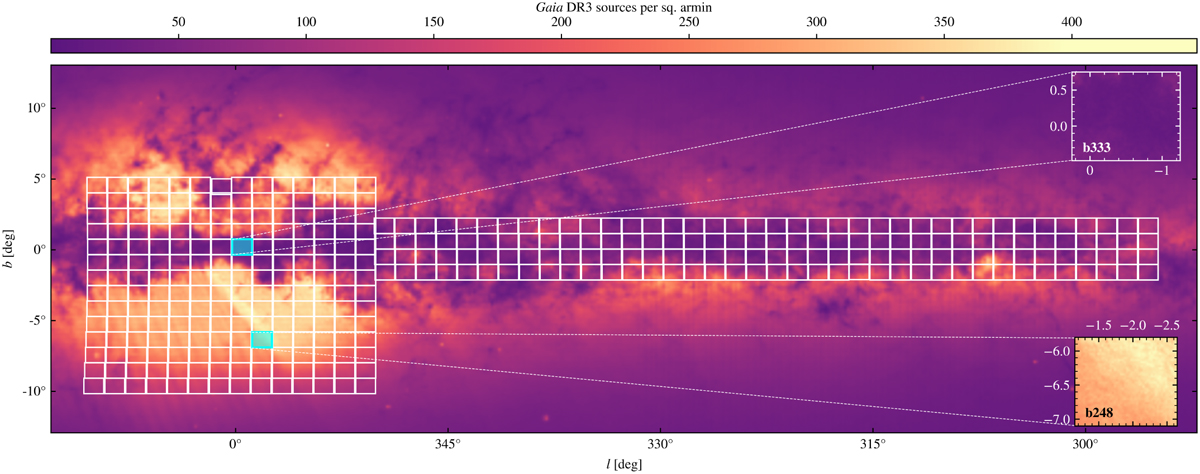
Gaia DR3 source density around the region covered by the VVV survey. White boxes represent VVV tiles. We highlight in light blue the two tiles considered in this work; namely, b333 in the Galactic center and b248 on the southern bulge. Density map data were taken from the Gaia archive.
Current usage metrics show cumulative count of Article Views (full-text article views including HTML views, PDF and ePub downloads, according to the available data) and Abstracts Views on Vision4Press platform.
Data correspond to usage on the plateform after 2015. The current usage metrics is available 48-96 hours after online publication and is updated daily on week days.
Initial download of the metrics may take a while.