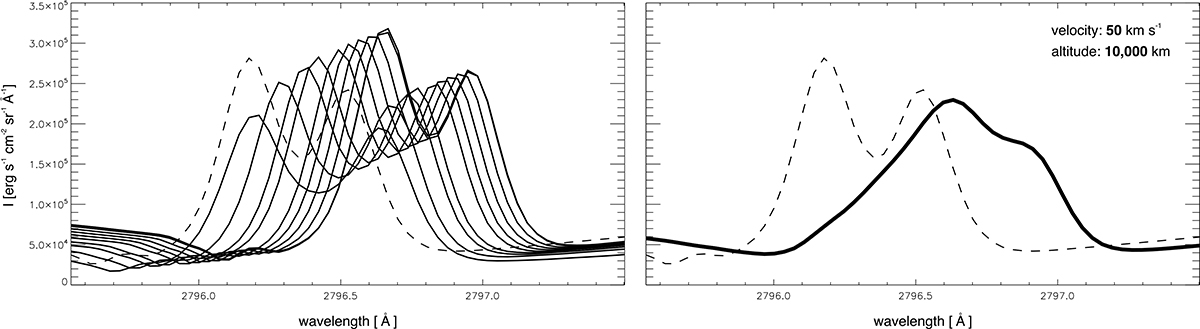
Fig. 6.
Download original image
Illustration of mechanism causing strong asymmetries in the incident radiation Mg II K line profiles received by moving plasma. This example is for a radial velocity of 50 km s−1 and altitude of 10 000 km. In the left panel are ten profiles corresponding to the solar-disc illumination from ten concentric-ring zones of Gunár et al. (2021). The profile with the largest shift from the static case (dashed lines) corresponds to the zone at the disc centre. The profile with the least Doppler shift corresponds to the zone at the limb. In the right panel is the averaged profile from all zones.
Current usage metrics show cumulative count of Article Views (full-text article views including HTML views, PDF and ePub downloads, according to the available data) and Abstracts Views on Vision4Press platform.
Data correspond to usage on the plateform after 2015. The current usage metrics is available 48-96 hours after online publication and is updated daily on week days.
Initial download of the metrics may take a while.