Fig. 5.
Download original image
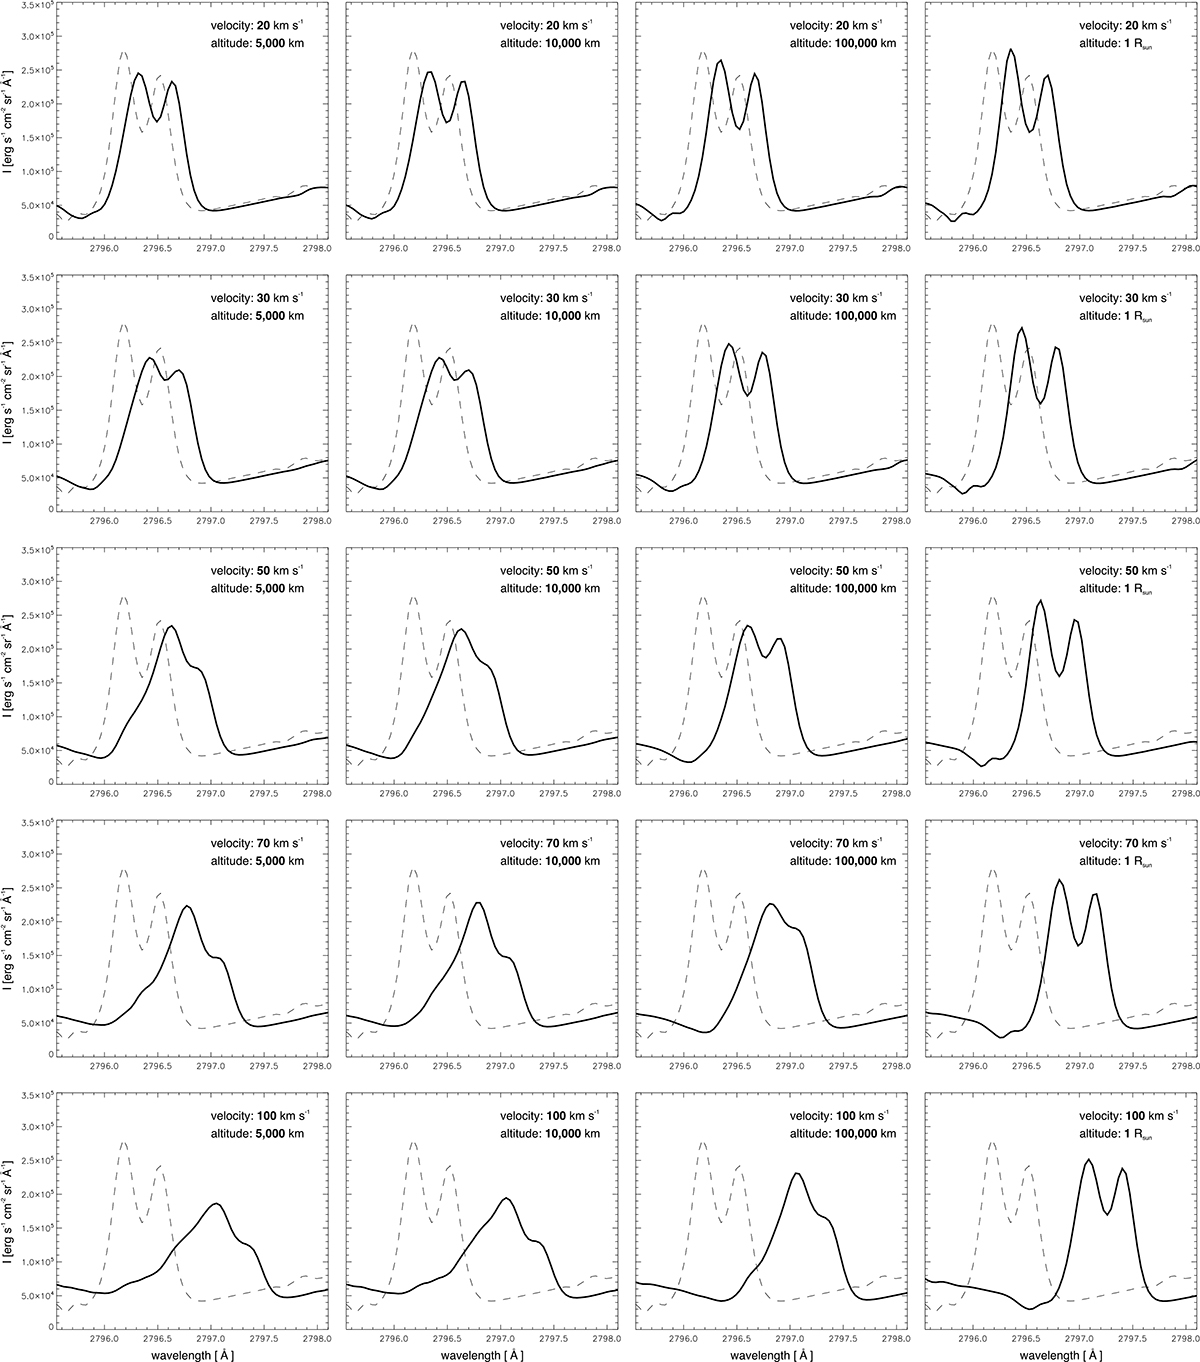
Disc-averaged profiles of the Mg II K line (solid lines) seen by plasma at different altitudes when moving with different velocities. Altitudes: 5000 km, 10 000 km, 100 000 km, and 1RSun (from left to right). Radial velocities: 20 km s−1, 30 km s−1, 50 km s−1, 70 km s−1, and 100 km s−1 (from top to bottom). The static angle-averaged profile is plotted in each panel using the dashed line. We note that we do not take into account the dilution factor.
Current usage metrics show cumulative count of Article Views (full-text article views including HTML views, PDF and ePub downloads, according to the available data) and Abstracts Views on Vision4Press platform.
Data correspond to usage on the plateform after 2015. The current usage metrics is available 48-96 hours after online publication and is updated daily on week days.
Initial download of the metrics may take a while.