Fig. 6
Download original image
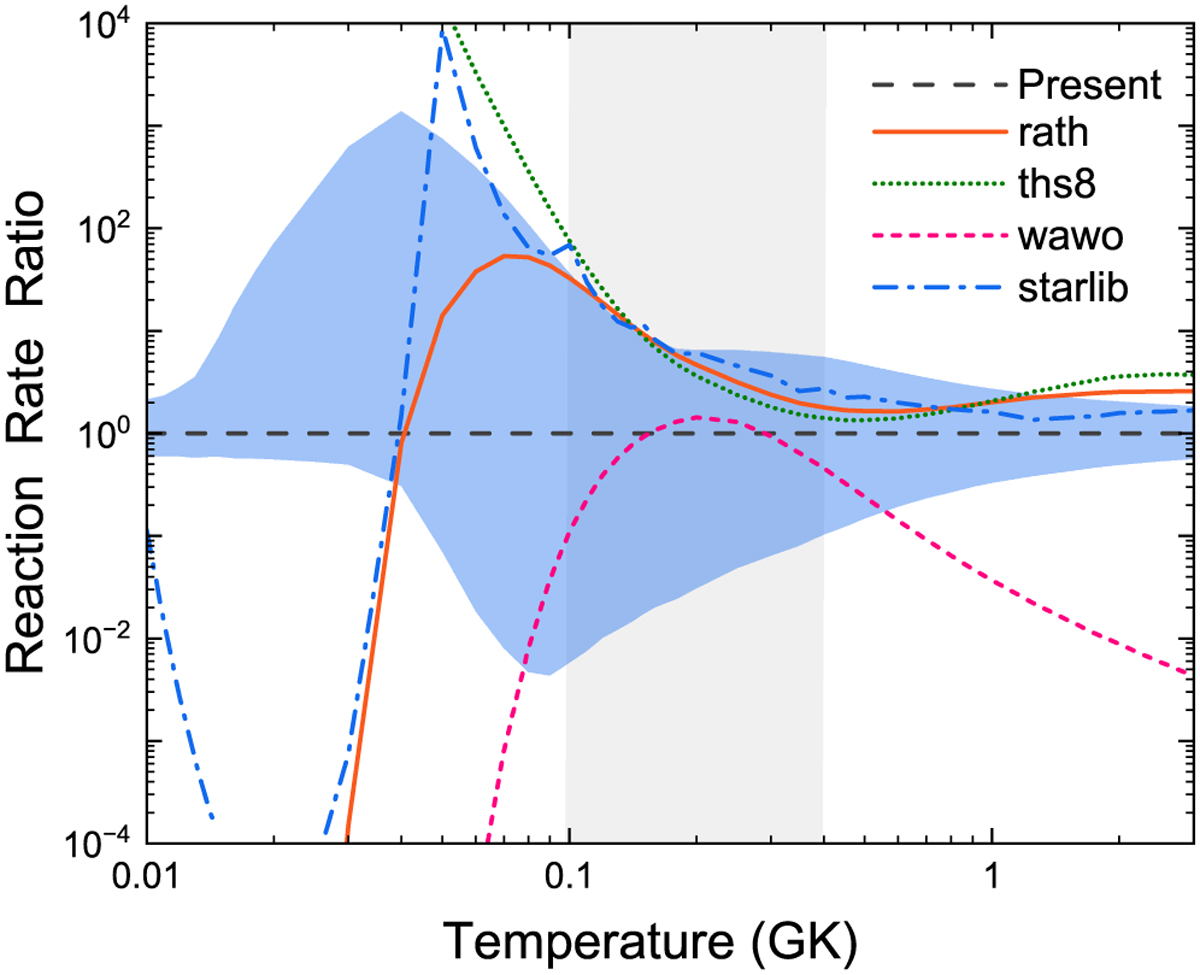
Ratio of previous 28P(p, γ)29S rates normalized to present recommended rate (the median rates in Table 5). The different line patterns correspond to the rates from Rauscher & Thielemann (2000), Cyburt et al. (2010), Wallace & Woosley (1981), and Sallaska et al. (2013), as marked in rath, ths8, wawo, and starlib, respectively. The shallow blue shaded areas correspond to 68% coverage probabilities, labeled as “Low” and “High” in Table 5. The vertical shallow gray band indicates the typical temperature range of nova nuclear burning.
Current usage metrics show cumulative count of Article Views (full-text article views including HTML views, PDF and ePub downloads, according to the available data) and Abstracts Views on Vision4Press platform.
Data correspond to usage on the plateform after 2015. The current usage metrics is available 48-96 hours after online publication and is updated daily on week days.
Initial download of the metrics may take a while.