Fig. 7
Download original image
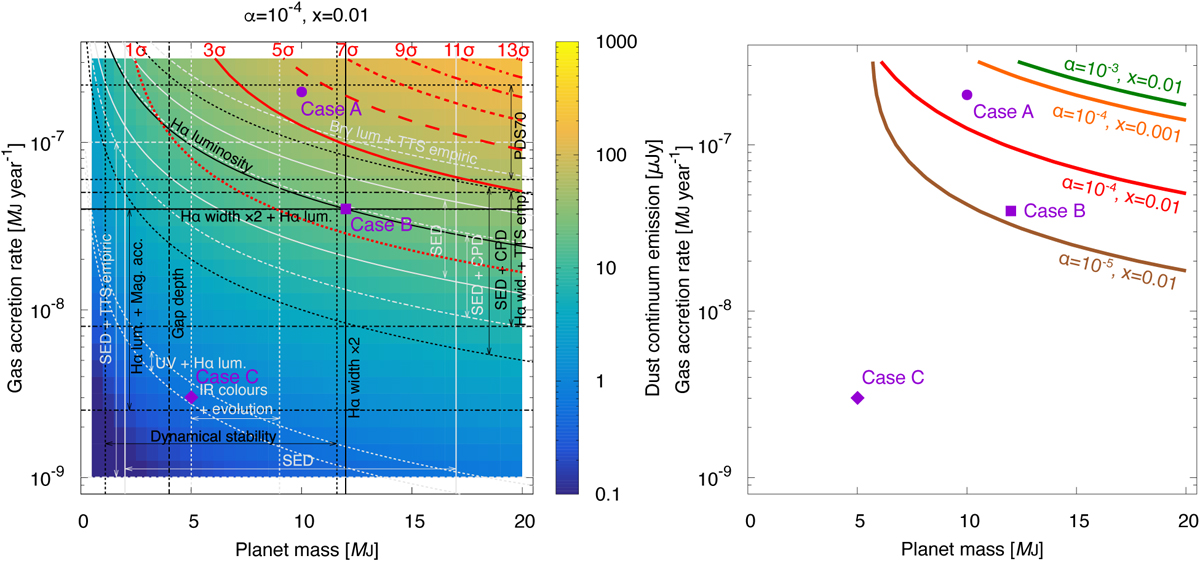
Same as Fig. 6 but for PDS 70 b. The purple circles, squares, and diamonds respectively represent the planet properties of the three cases; Case A (![]() ; same with the plausible case of PDS 70 c), Case B (Mpl = 12 MJ and
; same with the plausible case of PDS 70 c), Case B (Mpl = 12 MJ and ![]() ), and Case C (Mpl = 5 MJ and
), and Case C (Mpl = 5 MJ and ![]() ). (Left) The red curves represent the signal to noise ratios (1σ = 15.7 μJy) if the dust emission were detected in the observation by Benisty et al. (2021). The black curves and lines represent the previous estimates of the properties listed in Table 2. The light grey curves and lines also represent the previous estimates, but they are from different works from those of PDS 70 c. (Right) The red, brown, green, and orange curves represent the 3σ = 47.1 μJy noise levels with (α, x) = (10−4, 0.01), (10−5, 0.01), (10−3, 0.01), and (10−4, 0.001), respectively.
). (Left) The red curves represent the signal to noise ratios (1σ = 15.7 μJy) if the dust emission were detected in the observation by Benisty et al. (2021). The black curves and lines represent the previous estimates of the properties listed in Table 2. The light grey curves and lines also represent the previous estimates, but they are from different works from those of PDS 70 c. (Right) The red, brown, green, and orange curves represent the 3σ = 47.1 μJy noise levels with (α, x) = (10−4, 0.01), (10−5, 0.01), (10−3, 0.01), and (10−4, 0.001), respectively.
Current usage metrics show cumulative count of Article Views (full-text article views including HTML views, PDF and ePub downloads, according to the available data) and Abstracts Views on Vision4Press platform.
Data correspond to usage on the plateform after 2015. The current usage metrics is available 48-96 hours after online publication and is updated daily on week days.
Initial download of the metrics may take a while.