Fig. 6
Download original image
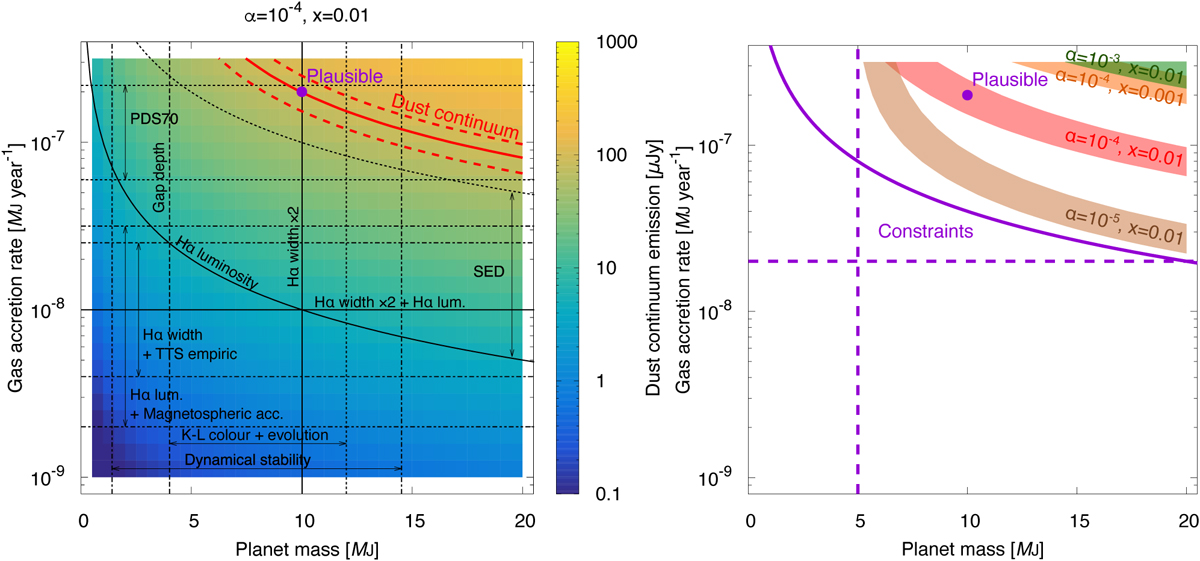
Predicted flux density of dust emission from the CPD of PDS 70 c when the planet mass and gas accretion rate are Mpl = (0.5–20) MJ and ![]() MJ yr−1. The purple circles represent the plausible planet properties:
MJ yr−1. The purple circles represent the plausible planet properties: ![]() (Left) The strength of turbulence and the dust-to-gas mass ratio in the inflow are fixed as α = 10−4 and x = 0.01, respectively. The red solid and dashed curves represent the planet property range reproducing the observed value, 86 ± 16 μJy (Benisty et al. 2021). The black curves and lines represent the previous estimates of the properties listed in Table 2. (Right) The red, brown, green, and orange shaded regions represent the planet property ranges reproducing the observed value with (α, x) = (10−4, 0.01), (10−5, 0.01), (10−3, 0.01), and (10−4, 0.001), respectively. The solid purple curve is the obtained constraint on MMdot:
(Left) The strength of turbulence and the dust-to-gas mass ratio in the inflow are fixed as α = 10−4 and x = 0.01, respectively. The red solid and dashed curves represent the planet property range reproducing the observed value, 86 ± 16 μJy (Benisty et al. 2021). The black curves and lines represent the previous estimates of the properties listed in Table 2. (Right) The red, brown, green, and orange shaded regions represent the planet property ranges reproducing the observed value with (α, x) = (10−4, 0.01), (10−5, 0.01), (10−3, 0.01), and (10−4, 0.001), respectively. The solid purple curve is the obtained constraint on MMdot: ![]() . The vertical and horizontal dashed purple lines represent the obtained constraints on the planet mass and the gas accretion rate, Mpl ≥ 5 MJ and
. The vertical and horizontal dashed purple lines represent the obtained constraints on the planet mass and the gas accretion rate, Mpl ≥ 5 MJ and ![]() respectively.
respectively.
Current usage metrics show cumulative count of Article Views (full-text article views including HTML views, PDF and ePub downloads, according to the available data) and Abstracts Views on Vision4Press platform.
Data correspond to usage on the plateform after 2015. The current usage metrics is available 48-96 hours after online publication and is updated daily on week days.
Initial download of the metrics may take a while.