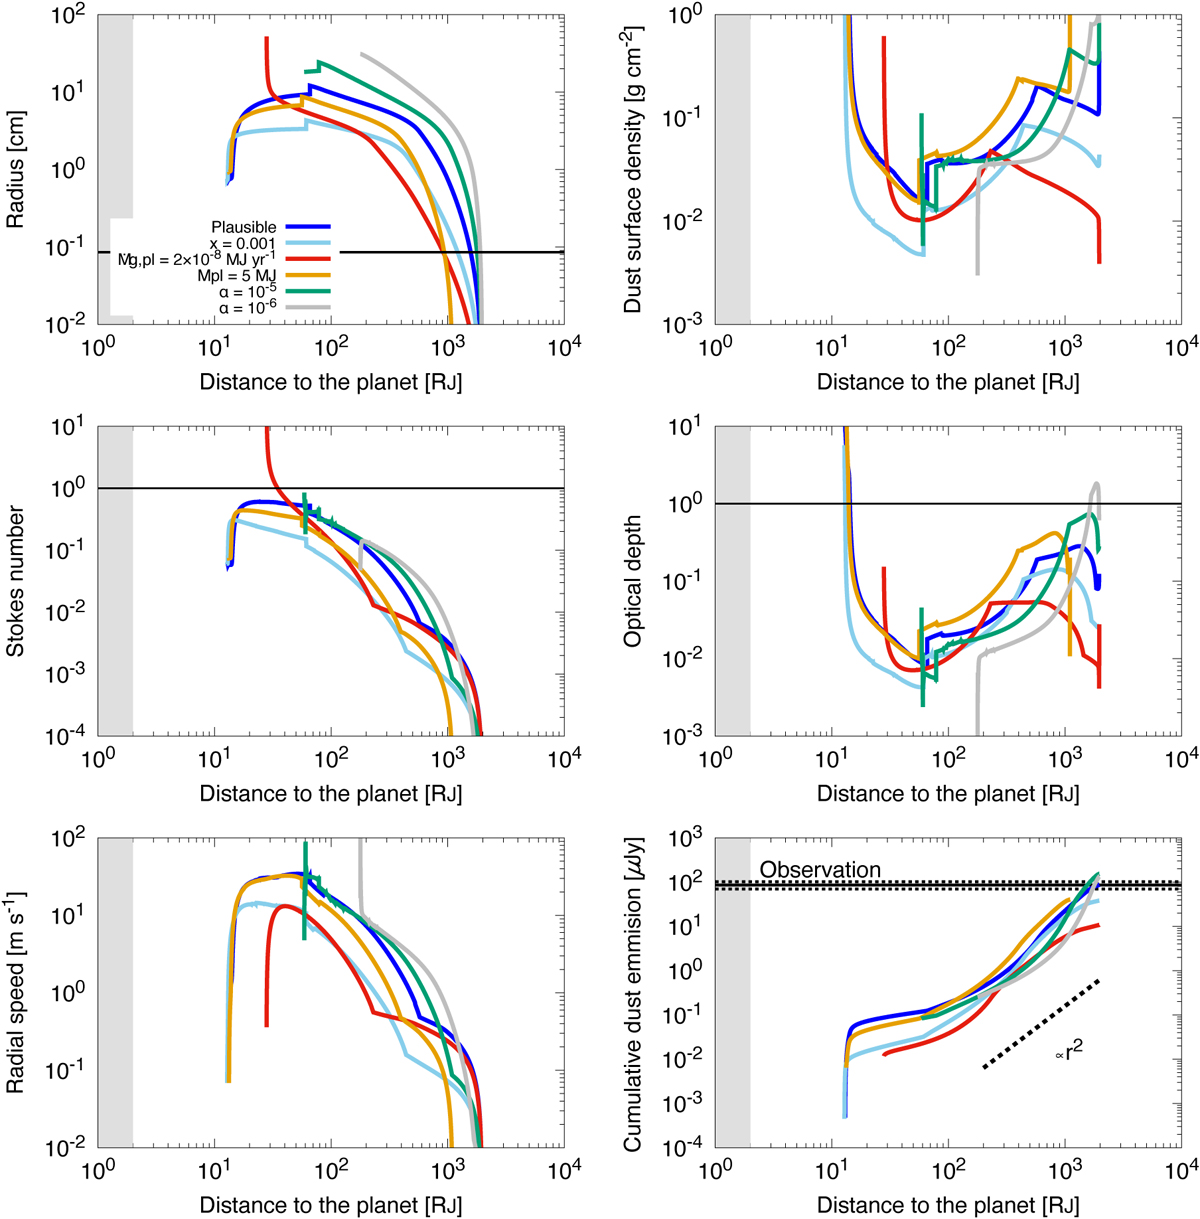
Fig. 3
Download original image
Dust evolution in the CPD of PDS 70 c with various parameter sets. The left top, left middle, left bottom, right top, right middle, and right bottom panels represent the dust radial profiles of radius, Stokes number, radial drift speed, surface density, optical depth, cumulative flux density contribution of dust emission from the centre of the disc, respectively. The colour variation is same with Fig. 2. The black lines in the left top, left middle, right middle, and right bottom panels are the wavelength of the observation (λ = 855 μm), unity (i.e. showing the highest radial drift speed), unity (i.e. showing optically thick or thin), and the observed dust emission value 86 ± 16 μJy (Benisty et al. 2021), respectively.
Current usage metrics show cumulative count of Article Views (full-text article views including HTML views, PDF and ePub downloads, according to the available data) and Abstracts Views on Vision4Press platform.
Data correspond to usage on the plateform after 2015. The current usage metrics is available 48-96 hours after online publication and is updated daily on week days.
Initial download of the metrics may take a while.