Open Access
Fig. 9
Download original image
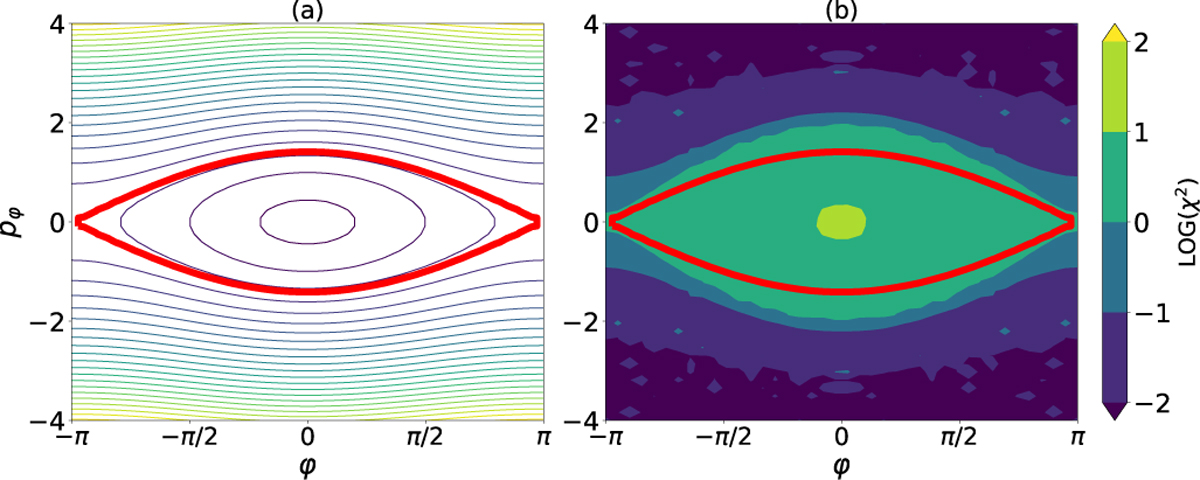
χ2 map for the standard pendulum model, (a) Phase structure (energy level) on (φ, pφ) plane. The broad red curve marks the separatrix between the libration and circulation region, (b) χ2 value in logarithm indicated by colour.
Current usage metrics show cumulative count of Article Views (full-text article views including HTML views, PDF and ePub downloads, according to the available data) and Abstracts Views on Vision4Press platform.
Data correspond to usage on the plateform after 2015. The current usage metrics is available 48-96 hours after online publication and is updated daily on week days.
Initial download of the metrics may take a while.