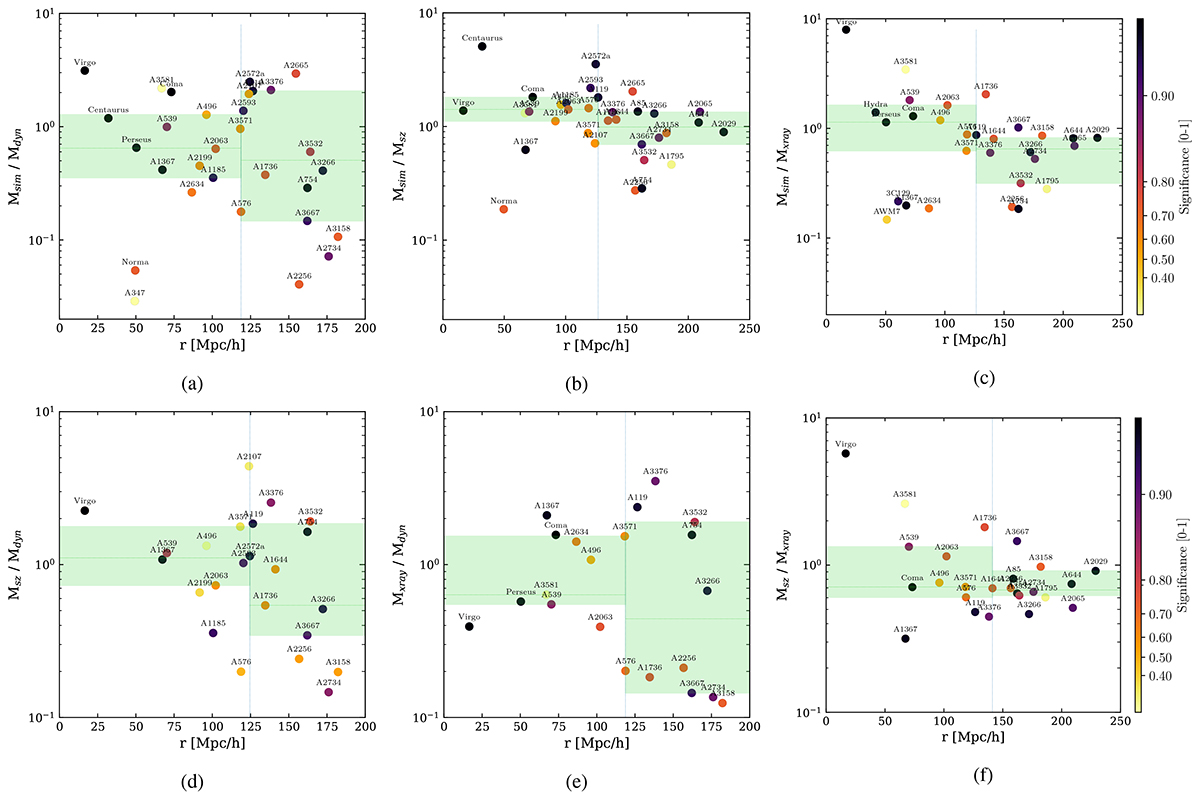
Fig. 7.
Download original image
Mass ratios as a function of total distance. The top figures present the mass ratio between SUBFIND-estimated M500 and three different mass estimations: (a) M500 derived from the dynamical mass as provided in the Tully galaxy group catalog (Tully 2015): Mdyn, (b) M500 derived from SZ measurements as available in the Planck database: MSZ, and (c) M500 derived from X-ray observations: Mxray. These ratios are plotted against the total distance of the cluster. In addition, the bottom figures illustrate the ratios between various observational mass estimations: (d) Msz/Mdyn, (e) Mxray/Mdyn, and (f) Msz/Mxray, all in relation to the total distance of the cluster. (For further details on the observed quantities, please refer to Table A.2). A vertical dashed line divides the clusters into two sets with an equal number of clusters. The green horizontal lines represent the median values for each set, while the green shaded regions indicate the range that encompasses 50% of the clusters above and below the median.
Current usage metrics show cumulative count of Article Views (full-text article views including HTML views, PDF and ePub downloads, according to the available data) and Abstracts Views on Vision4Press platform.
Data correspond to usage on the plateform after 2015. The current usage metrics is available 48-96 hours after online publication and is updated daily on week days.
Initial download of the metrics may take a while.