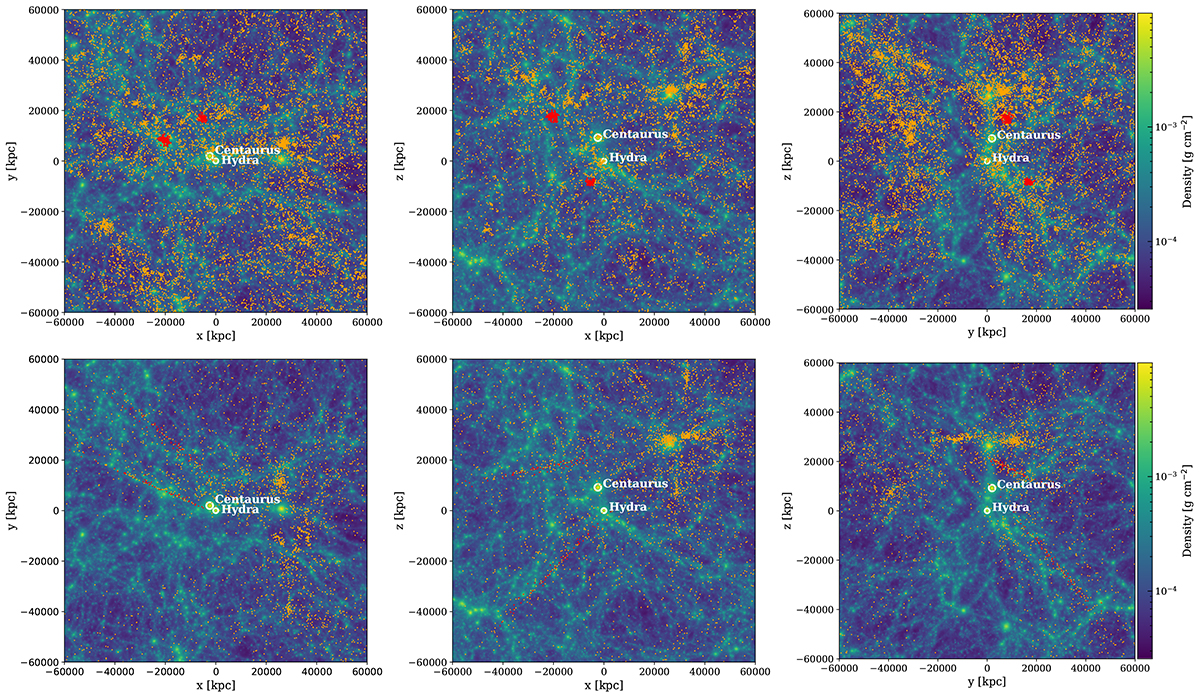
Fig. 6.
Download original image
Density map of the Centaurus-Hydra region in the SLOW simulation, presented in supergalactic coordinates and created using SMAC. The locations of the Centaurus and Hydra clusters are marked with two white circles, each indicating the R500 radius of the respective structures. In the top panels, observed galaxies from the 2MRS1175 North Groups catalog associated with Centaurus and Hydra are highlighted in red. Additionally, galaxies listed in both the 2MRS1175 North and South Groups catalogs are shown in orange. These galaxy positions have been corrected to account for distortions such as the “fingers of god” effect. In the bottom panels, all galaxies from the CF-2 Catalog in this area are displayed in orange, with those attributed to Centaurus and Hydra in red, without adjusting for the “fingers of god” correction.
Current usage metrics show cumulative count of Article Views (full-text article views including HTML views, PDF and ePub downloads, according to the available data) and Abstracts Views on Vision4Press platform.
Data correspond to usage on the plateform after 2015. The current usage metrics is available 48-96 hours after online publication and is updated daily on week days.
Initial download of the metrics may take a while.