Fig. 5.
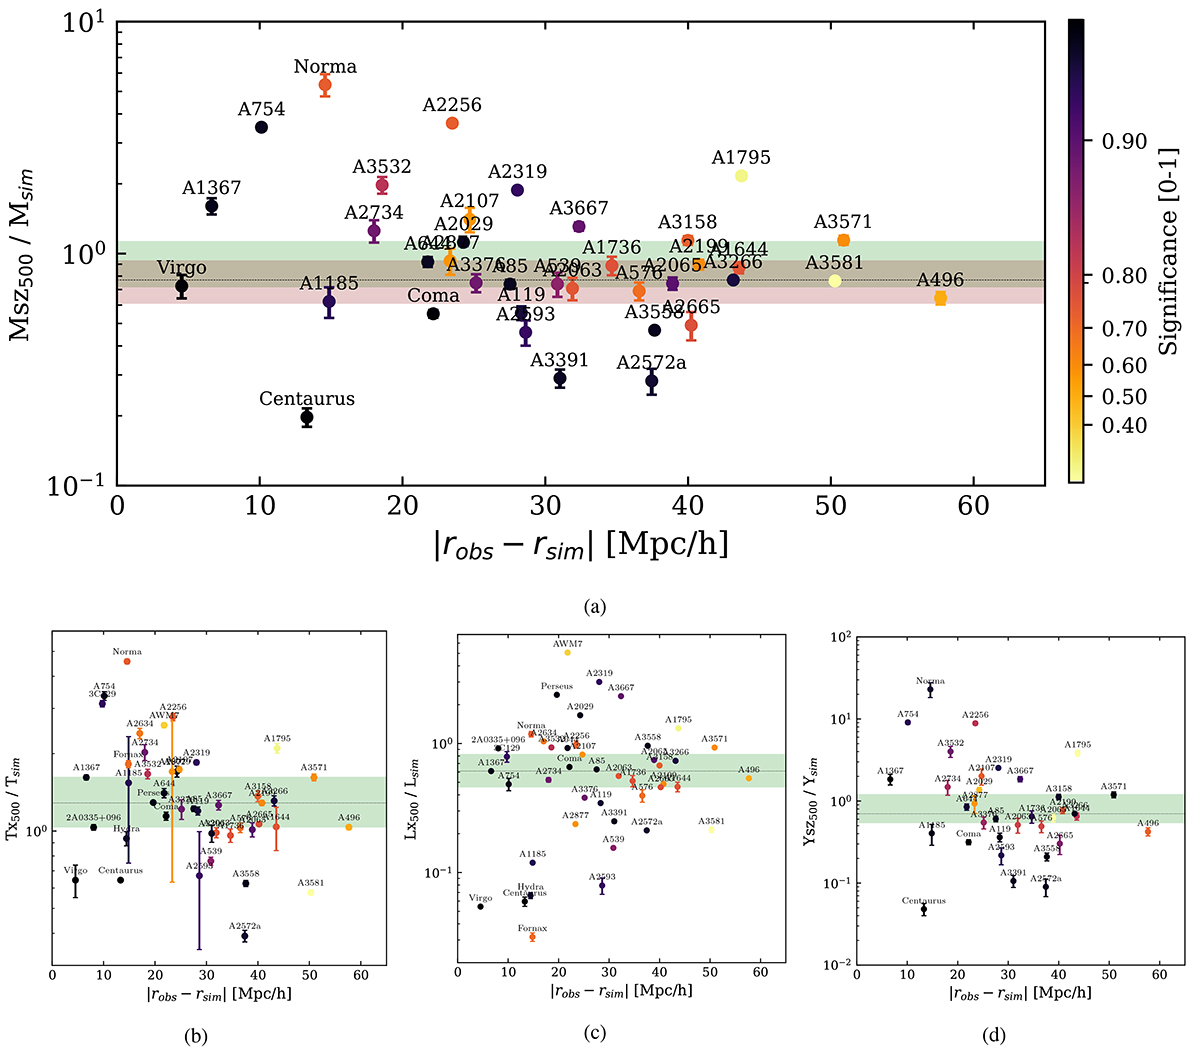
Download original image
Simulated and observed quantities’ ratios as a function of relative distance. (a) Ratio between the M500 mass, derived from the cluster SZ signal, and the SUBFIND-estimated M500 as a function of relative distance. The dotted line corresponds to the median of the distribution, while the shaded red region depicts the observed dispersion in the Compton-y–mass scaling relations (Planck Collaboration XI 2011). The three bottom panels present similar ratios for (b) X-ray luminosity (L500), (c) X-ray temperature (T500), (d) and SZ-signal (Y500). These data points are color-coded based on their mass significance, with higher significance levels indicated in black and lower significance levels denoted in yellow.
Current usage metrics show cumulative count of Article Views (full-text article views including HTML views, PDF and ePub downloads, according to the available data) and Abstracts Views on Vision4Press platform.
Data correspond to usage on the plateform after 2015. The current usage metrics is available 48-96 hours after online publication and is updated daily on week days.
Initial download of the metrics may take a while.