Fig. 4.
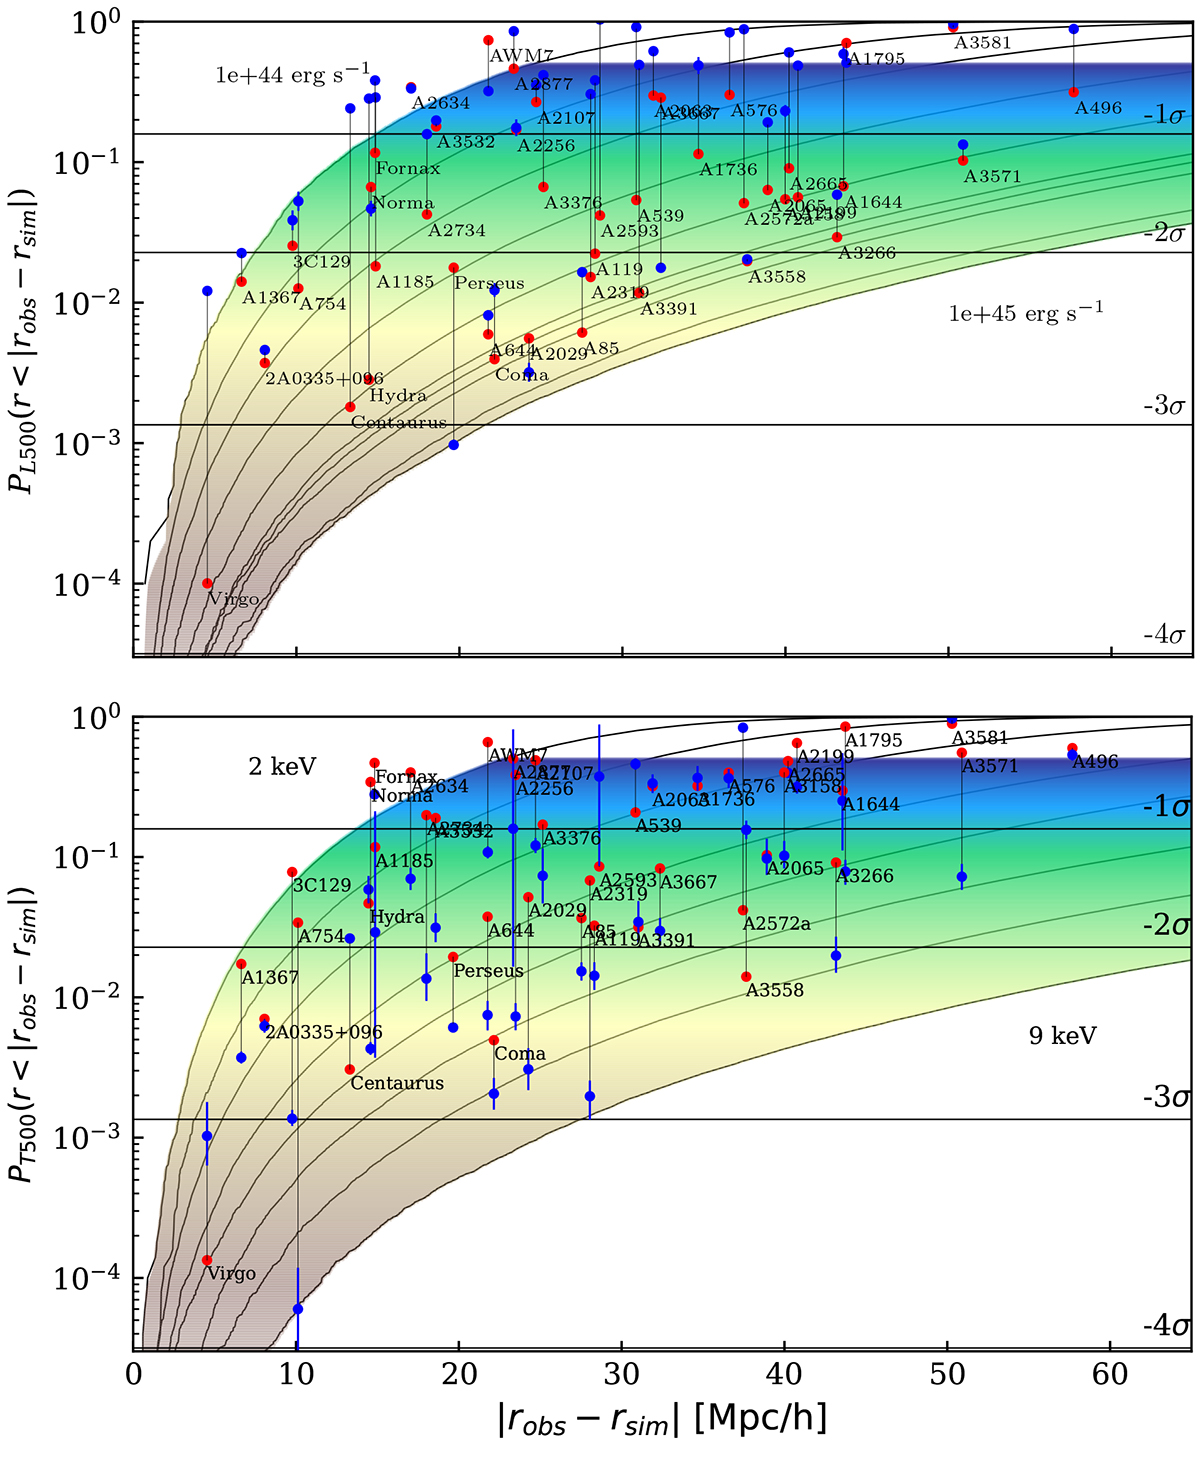
Download original image
Similar to Fig. 3, we show cumulative distribution functions for Lx and Tx within R500. For a better comparison with observations, we estimated the X-ray luminosity in the band 0.1–2.4 keV for every cluster using SMAC. In the top panel, the bin values range from 1044 erg × s−1 to 1045 erg × s−1, with increments of 10. Uneven spacing between higher-value bins has to do with the inherent limitations of small number statistics within our cosmological box (see Sect. 5.2 for a deeper discussion). The bottom panel presents the cumulative distribution function from the X-ray temperature in R500. We estimated this temperature using SUBFIND. The bin values range from 2 keV to 9 keV, with increments of 1 keV.
Current usage metrics show cumulative count of Article Views (full-text article views including HTML views, PDF and ePub downloads, according to the available data) and Abstracts Views on Vision4Press platform.
Data correspond to usage on the plateform after 2015. The current usage metrics is available 48-96 hours after online publication and is updated daily on week days.
Initial download of the metrics may take a while.