Fig. 3.

Download original image
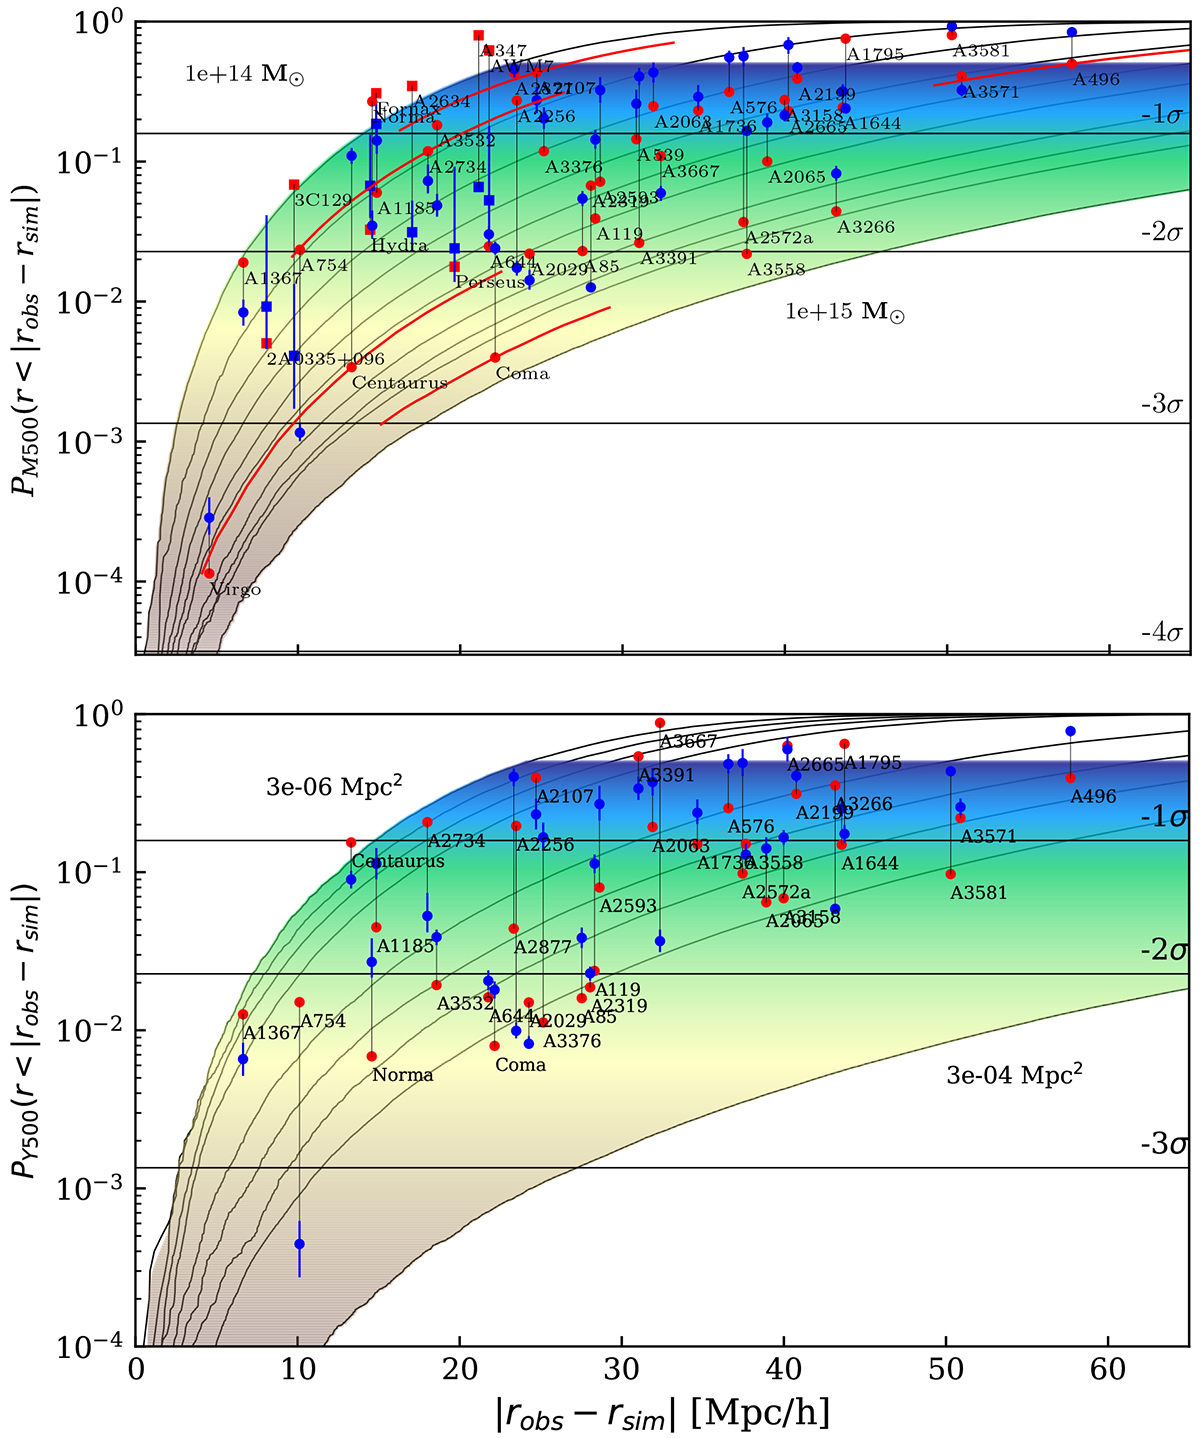
Cumulative distribution functions for M500 and Y500, respectively. The top panel displays bins ranging from 1015 to 1014 M⊙, with increments of ten, showing the random expectation of finding a cluster of a certain mass or higher within a sphere whose radius corresponds to the distance displayed on the x-axis. Simulated M500 values, as estimated by SUBFIND, are represented in red. The blue data points represent the observed M500 values obtained from clusters Planck signals, including their associated errors. In cases where SZ-derived M500 values were unavailable, X-ray-derived M500 values were used (indicated by square points). For cluster A347 X-ray-derived mass information was not available, thus we used the M500 mass derived by converting the dynamical mass estimated by Tully. The observational uncertainties in the cluster’s position for Coma, A2734, AWM7, and Centaurus are represented by red lines, as an illustrative example of how such positional uncertainty can impact the results of the significance study (see Sect. 5.2 for a more comprehensive discussion). The bottom panel displays the cumulative distribution function for the SZ-derived signal in R500. Simulated datapoint values where estimated using SMAC (Dolag et al. 2005a). The bins range from 3 × 10⁻⁶ to 3 × 10⁻⁴ Mpc2, with increments of 2.
Current usage metrics show cumulative count of Article Views (full-text article views including HTML views, PDF and ePub downloads, according to the available data) and Abstracts Views on Vision4Press platform.
Data correspond to usage on the plateform after 2015. The current usage metrics is available 48-96 hours after online publication and is updated daily on week days.
Initial download of the metrics may take a while.


